Thermal, rheological and strength models
In this subtopic we present the first global strength and effective elastic thickness maps, which are determined using physical properties from recent crustal and lithospheric models. Temperature variations in the lithosphere are derived from seismic velocities using a mineral-physics approach with additional constraints from geothermal modelling.
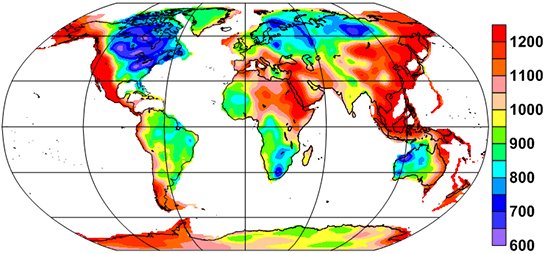
Temperature is one of the key parameters controlling lithospheric dynamics and rheology. Up to now, the temperature distribution is directly determined only in the shallowest part of the crust (0-5 km). Temperature estimates for the deeper horizons, where the heat transport is mostly conductive, require a precise knowledge of many crustal parameters (chiefly thermal conductivity and heat production), which are extremely uncertain. Therefore, indirect approaches are often used to determine temperature distributions within crust and mantle. We derive a global temperature distribution in the lithosphere by inverting the S-wave tomography model of Ritsema et al. 2004 and 2011. In the mineral physics approach (Cammarano et al., 2003) we take into account the anharmonic and anelasticity effects for various composite mineralogies at different P-T conditions. Temperatures estimated at a depth of 100 km (Fig. 1) show strong lateral variability in the continents.
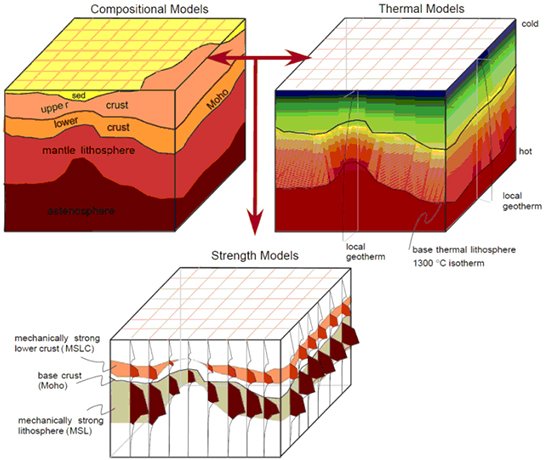
Strength of the lithosphere, or maximum stress it can support before failing, has been debated since the beginning of the last century (Barrell, 1914) because its spatial and temporal variations are key in geodynamics. The strength of the lithosphere is controlled by its depth-dependent rheological structure, which depends on thickness of different layers, composition and thermal properties (Figure 2). Also fluids and strain rate play an important role.

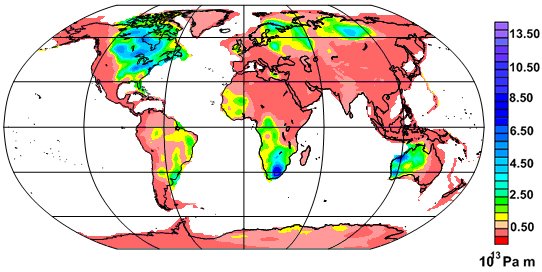
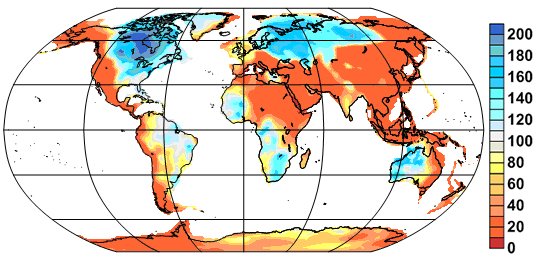
The total strength of the lithosphere has been estimated worldwide using physical properties from recent crustal, rheological and thermal models (Tesauro et al., 2012a-b). Pronounced differences of the strength and elastic plate thickness of the lithosphere are found between the old cratons and the areas affected by Tertiary volcanism, which also coincides with the boundaries of seimogenic zones (Figure 4). Lithospheric strength is primarily controlled by the crust in the young (Phanerozoic) geological provinces, while in the old (Achaean and Proterozoic) cratons strength is primarily concentrated in the lithospheric mantle.
Literatur
- Kaban, M.K.; Schwintzer, P.; Artemieva, I.M.; Mooney, W.D., (2003): Density of the continental roots: compositional and thermal contributions. Earth and Planetary Science Letters, 209, 53-69, doi:10.1016/S0012-821X(03)00072-4 .
- Tesauro, M.; Kaban, M.K.; Cloetingh, S.A.P.L. (2012a): Global strength and elastic thickness of the lithosphere, Global and Planetary Change, 90–91, 51–57, doi:10.1016/j.gloplacha.2011.12.003.
- Tesauro, M.; Kaban, M.K.; Cloetingh, S.A.P.L. (2012b): Global model for the lithospheric strength and effective elastic thickness. Tectonophysics, 602, 78-86, doi: 10.1016/j.tecto.2013.01.006 .
- Tesauro, M.; Audet, P.; Kaban, M.K., Bürgmann, R.; Cloetingh, S.A.P.L. (2012): The effective elastic thickness of the continental lithosphere: Comparison between rheological and inverse approaches. Geochemistry, Geophysics, Geosystems (G3), 13, 9, Q09001, doi:10.1029/2012GC004162.


