


Dichte-Struktur der Erde
Dieses Thema fokussiert auf die Konstruktion umfassender Modelle der Lithosphäre und des Erdmantels mittels kombinierter Analysen von Schwere-, seismischen und anderen geodätischen, geophysikalischen sowie geologischen Daten. Eine wesentliche Frage hierbei ist, inwieweit diese Modelle in Verbindung stehen mit tektonischen und geodynamischen Prozessen. Im Besonderen befassen wir uns mit der Dichteverteilung im Erdinnern, da deren Variabilität maßgeblich die gestaltbildenden Prozesse unseres Planeten steuert. Ein weiteres wichtiges Ziel ist die Bestimmung der rheologischen und thermischen Strukturen der Lithosphäre, die eine Verbindung zu Oberflächenprozessen liefern, wie beispielsweise solche, die im Zusammenhang mit atmosphärisch-ozeanischer, kontinental-hydrologischer oder kryosphärischer Dynamik stehen. Die erstellten Modelle folgen einer hierarchischen Ordnung, bei der hochauflösende regionale Modelle in ein generalisiertes globales Modell eingebettet werden.
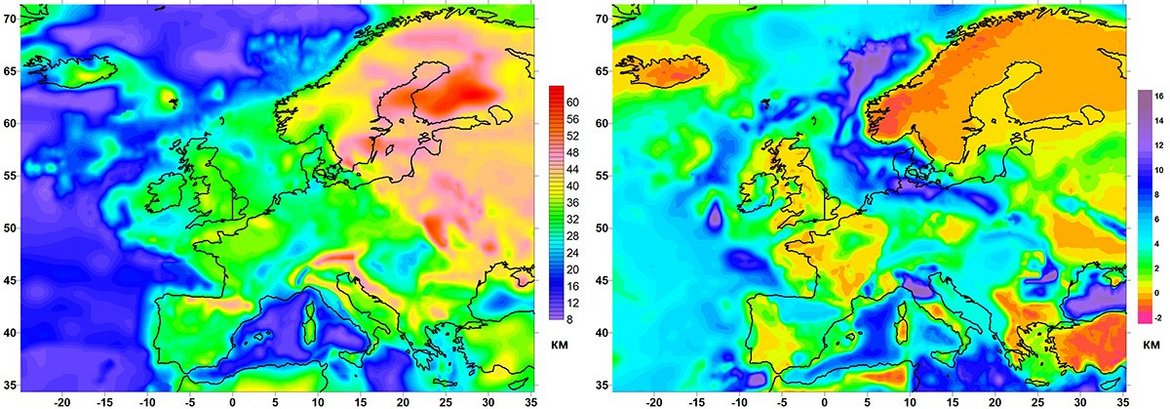
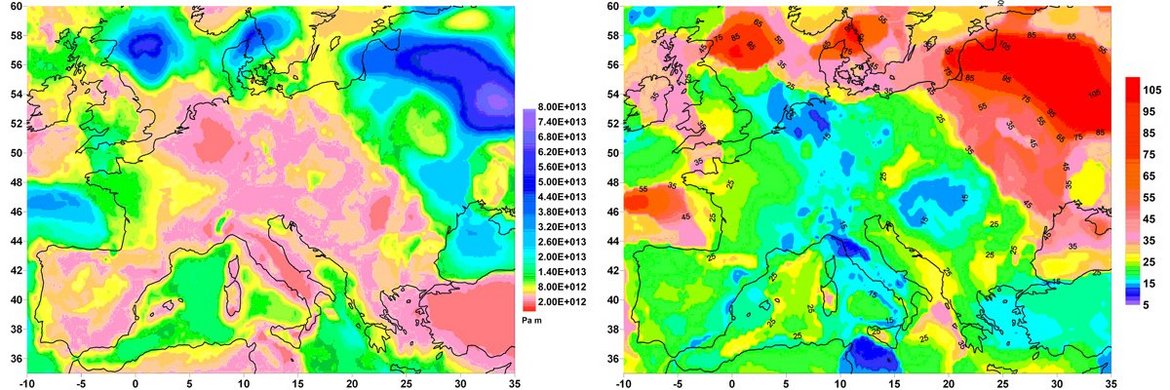
A new integrative model of the European lithosphere has been constructed based on the analysis of several data sets (primarily data on crustal structure, a new seismic tomography model showing heterogeneity of the upper mantle and gravity data) which are principally improved compared to previous studies (Tesauro et al., 2008; 2009a; 2009b, 2010a; 2010b; Koulakov et al., 2009; Kaban et al., 2010) This model includes all principal physical (density, temperature, velocity) and rheological parameters. Therein, a new high-resolution (15’x15’) reference crustal model (EuCRUST-07) has been constructed for most of Europe which is based on the integration of nearly all existing seismic determinations in the area (Tesauro et al. 2008). It offers a starting point in any kind of numerical modeling, which has to resolve a trade-off between crustal and mantle effects.
The crustal model has been employed in a new tomography model for P- and S-velocity anomalies beneath Europe, which was a priori corrected for the crustal effect (Koulakov et al., 2009). This enables us to much better resolve the velocity structure in the uppermost mantle by removing a trade-off with the crustal structures. Inversion of the P-wave velocity of the tomography model for temperature allowed to derive a new thermal model of the lithosphere and to estimate lithospheric thickness variations (Tesauro et al., 2009a, 2010a).
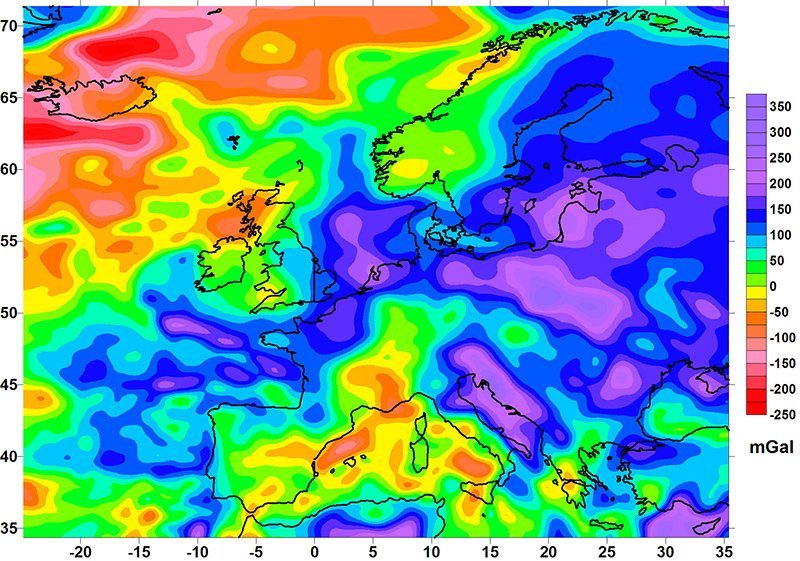
For construction of the density model of the crust and upper mantle, we jointly analyze the above results and the gravity field (Kaban et al., 2010). EuCRUST-07 is employed to calculate a gravity effect of the crust and to remove it from the observed field.
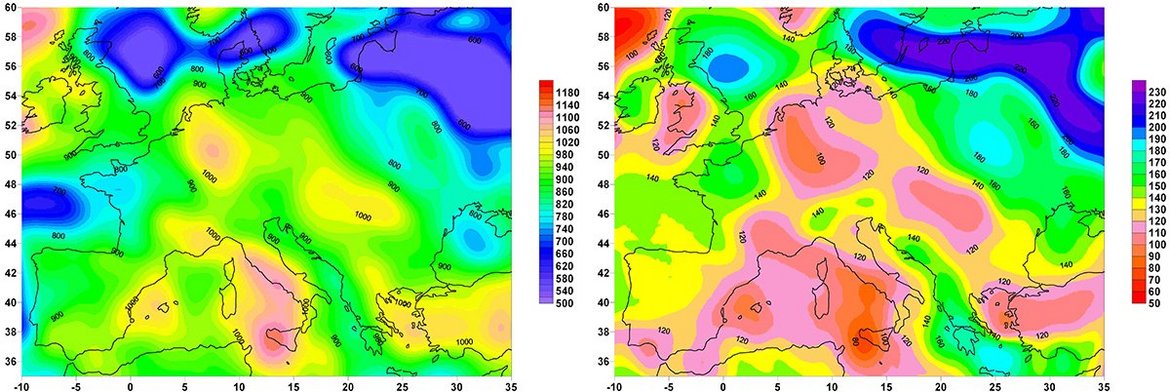
The obtained residual mantle gravity anomalies and residual topography are analyzed to characterize principal factors controlling mantle heterogeneity: temperature and compositional variations. The effect of temperature variations is estimated using the new thermal model (Figure 2). Then, the residual anomalies might be used to characterize compositional density anomalies in the upper mantle.
The obtained results have been used to estimate distribution of the strength of the European lithosphere. Identification of intraplate areas that are mechanically weaker or stronger provide a possibility to examine the heterogeneous response of the European lithosphere to large-scale plate tectonic forces and various modes of loading. It has been also calculated the effective elastic thickness of the lithosphere (Tesauro et al., 2009b).
Publications:
- Kaban, M. K., Chen, B., Tesauro, M.,Petrunin, A. G., El Khrepy, S., & Al-Arifi, N. (2018). Reconsidering effective elastic thickness estimates by incorporating the effect of sediments: A case study for Europe. Geophysical Research Letters, 45 (18), 9523-9532, doi: https://doi.org/10.1029/2018GL079732
- Tesauro, M.; Burov, E.; Kaban, M. K.; Cloetingh, S. (2011) Ductile crustal flow in Europe's lithosphere. Earth and Plan. Sci. Let., Volume 312, Issues 1-2, 254-265.
- Kaban, M. K.; Tesauro, M.; Thomas, M. (2010): Gravity modelling of the crust and upper mantle for understanding of tectonic processes: A case study for Europe. - In: Wang, X.; Xia, J.; Yan, J.; Xu, Y. (Eds.), Proceedings, Near-Surface Geophysics and Geohazards; Vol. 2, Science Press USA Inc., 748-752.
- Tesauro M., Kaban M.K., Cloetingh S.A.P.L.(2010): 3D crustal model of Western and Central Europe as a basis for modelling mantle structure. In: New Frontiers in Integrated Solid Earth Sciences, Eds.: Cloetingh, S.A.P.L. and Negendank, J.F.W. Springer-Verlag, p. 39-69.
- Kaban, M.K.; Tesauro, M. ; Cloetingh, S. (2010). An integrated gravity model for Europe's crust and upper mantle. Earth Plan. Sci. Let. doi: 10.1016/j.epsl.2010.04.041.
- Cloetingh S., J.D. van Wees, P.A. Ziegler, L. Lenkey, F. Beekman, M. Tesauro, A. Förster, B. Norden, M. Kaban, N. Hardebol, D. Bonté, A. Genter, L. Guillou-Frottier, M. Ter Voorde, D. Sokoutis, E. Willingshofer, T. Cornu and G. Worum. (2010): Lithosphere tectonics and thermo-mechanical properties: An integrated modelling approach for Enhanced Geothermal Systems exploration in Europe. Earth-Science Reviews, 102, Issues 3-4, 159-206.
- Tesauro M., M.K. Kaban, S. Cloetingh (2009): How rigid is Europe's lithosphere? Geophys. Res. Lett., 36, L16303, doi:10.1029/2009GL039229
- Koulakov I.; Kaban M.K.; Tesauro M.; Cloetingh S.A.P.L. (2009): P and S velocity anomalies in the upper mantle beneath Europe from tomographic inversion of ISC data. Geopys. J. Int., 179, 345-366, doi: 10.1111/j.1365-246X.2009.04279.x.
- Tesauro M.; Kaban M.K.; Cloetingh S.A.P.L. (2009a): A new thermal and rheological model of the European lithosphere. Tectonophysics, 476, 478-495, doi:10.1016/j.tecto.2009.07.022.
- Tesauro M.; Kaban M.K.; Cloetingh S.A.P.L. (2008): EuCRUST-07: A new reference model for the European crust. Geophysycal Research Letters 35, L05313, doi:10.1029/2007GL032244
- Tesauro M., M.K. Kaban, S. Cloetingh, N. Hardebol, F. Beekman (2007) 3D strength and gravity anomalies of the European lithosphere. Earth Plan. Sci. Let., v. 263, 56-73.
- Artemieva I., H. Thybo, and M. Kaban, (2006) Deep Europe today: Geophysical synthesis of the upper mantle structure and lithospheric processes over 3.5 By, in. European Lithosphere Dynamics, Eds.: David Gee and Randell Stephenson, Geol. Soc. London Mem., v. 32, 11-41.
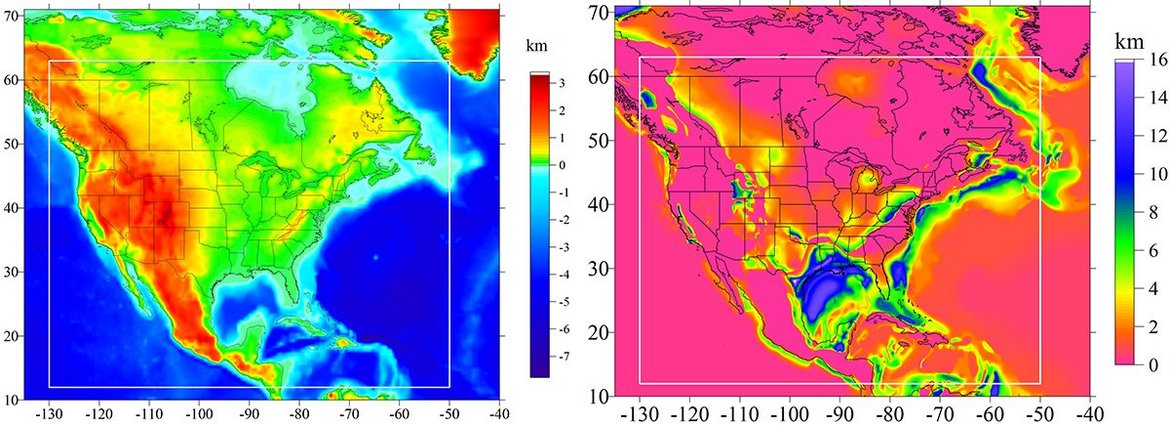
In cooperation with the US Geological Survey we investigate the density structure of the North American upper mantle based on the integrative analysis of the gravity field and seismic data. The results provide a possibility to understand the thermal state and composition of the lithosphere and to reconstruct its evolution. The basis of our study is the removal of the gravitational effect of the crust to determine mantle gravity anomalies (Kaban and Mooney, 2001, 2010). The effect of the crust is removed in three steps by subtracting the gravitational contributions of (1) topography and bathymetry, (2) low-density sedimentary accumulations, and (3) the 3D density structure of the crystalline crust as determined by seismic observations. In order to separate the contributions of mantle temperature anomalies from mantle compositional anomalies, we apply an additional correction to the mantle anomaly map for the thermal structure of the uppermost mantle. The thermal model is based on the conversion of seismic shear-wave velocity anomalies to temperature anomalies, and is consistent with mantle temperatures that are independently estimated from heat flow and heat production data. This thermally corrected mantle-gravity anomaly map reveals density anomalies that are chiefly due to compositional variations.
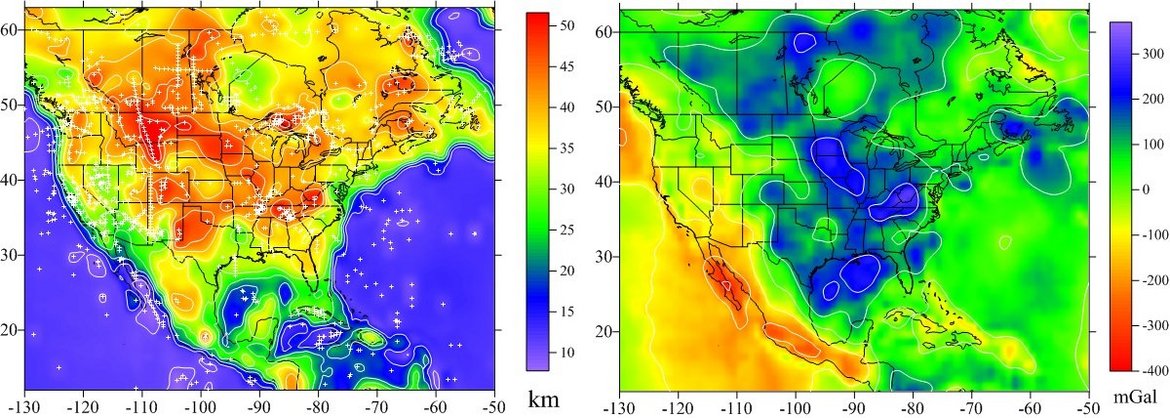
In order to separate the contributions of mantle temperature anomalies from mantle compositional anomalies, we apply an additional correction to the mantle anomaly map for the thermal structure of the uppermost mantle. The thermal model is based on the conversion of seismic shear-wave velocities to temperature, and is consistent with mantle temperatures that are independently estimated from heat flow and heat production data. The thermally-corrected mantle density map reveals density anomalies that are chiefly due to compositional variations.
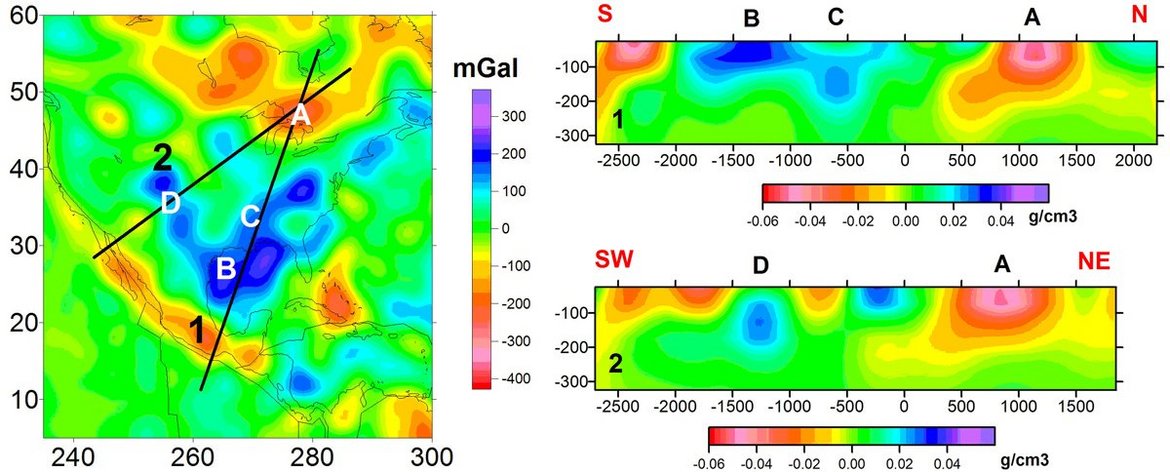
The low-density zone (A, Canadian Shield) appears after removing the thermal effect. It relates to the depleted mantle material. The horizontal shift of the root may be a result of the basal drag resulting from mantle flows. The strongest positive anomaly is co-incident with the Gulf of Mexico, and indicates a positive density anomaly in the upper mantle, possibly an eclogite layer that has caused subsidence in the Gulf. Two linear positive anomalies are also seen south of 40° N: one with a NE-SW trend in the eastern USA roughly coincident with the Grenville-Appalachians, and a second with a NW-SE trend beneath the states of Texas, New Mexico, and Colorado. These anomalies are interpreted as due to: (1) the presence of remnants of an oceanic slab in the upper mantle beneath the Grenville-Appalachian suture; and (2) mantle thickening caused by a period of shallow, flat subduction during the Laramie orogeny, respectively.
Based on these geophysical results, the evolution of the NA upper mantle is depicted in a series of maps and cartoons that display the primary processes that have formed and modified the North American crust and lithospheric upper mantle (Mooney and Kaban, 2010).
Publications:
- Kaban, M. K., Mooney, W. D., & Petrunin, A. G. (2015). Cratonic root beneath North America shifted by basal drag from the convecting mantle. Nature Geoscience, 8(10), 797-800., doi: 10.1038/ngeo2525.
- Kaban M.K.; Mooney, W.D. (2001): Density structure of the lithosphere in the Southwestern United States and its tectonic significance. J. Geophys. Res. 106(B1), 721-739, doi: 10.1029/2000JB900235.
- Kaban, M.K.; Mooney, W.D. (2010): A new density model of the upper mantle of North America. General Assembly European Geosciences Union (Vienna, Austria 2010), Geophysical Research Abstracts ; Vol 12, EGU2010-5301.
- Mooney, W.D; Kaban, M.K. (2010): The North American Upper Mantle: Density, Composition, and Evolution, J. Geophys. Res., 115, B12424, doi: 10.1029/2010JB000866.
- Kaban, M. K., Tesauro, M., Mooney, W. D., & Cloetingh, S. A. (2014). Density, temperature, and composition of the North American lithosphere—New insights from a joint analysis of seismic, gravity, and mineral physics data: 1. Density structure of the crust and upper mantle. Geochemistry, Geophysics, Geosystems, 15(12), 4781-4807.
- Tesauro, M., M. K. Kaban, W. D. Mooney, and S. A. P. L. Cloetingh (2014), Density, temperature, and composition of the North American lithosphere—New insights from a joint analysis of seismic, gravity, and mineral physics data: 2. Thermal and compositional model of the upper mantle. Geochem. Geophys. Geosyst. (G3), 15, doi: 10.1002/2014GC005484.
- Tesauro M., Kaban M.K., Mooney W.D., Cloetingh S. (2014) NACr14: A 3D model for the crustal structure of the North American Continent. Tectonophysics, 631, 65–86, DOI: 10.1016/j.tecto.2014.04.016.
- Tesauro, M., Kaban, M. K., & Mooney, W. D. (2015). Variations of the lithospheric strength and elastic thickness in North America. Geochemistry, Geophysics, Geosystems, 16(7), 2197-2220., DOI: 10.1002/2015GC005937.


New seismic data on the crust and upper mantle of South America have recently become available and describe its deep structure with unprecedented resolution. Here, seismic data are combined with gravity data and mineral physics constraints to develop self-consistent models of the temperature, composition and density of the South American lithospheric and sub-lithospheric upper mantle. A new model of the crustal structure was developed, including sediment and average crustal density and depth to the Moho (Fig. 1). This crustal model was used to correct the gravity field and obtain the residual topography. Then, an initial temperature model, derived from seismic tomography and mineral physics, was improved through an iterative process based on the joint inversion of gravity and residual topography (Fig.2). The results reveal iron depletion in the deep cratonic roots present under wide parts of the Amazon, São Francisco and Paranapanema cratons, but not under the Rio de la Plata and Parnaíba cratons. These cratons probably never developed lithospheric roots or were rejuvenated during subsequent tectonic events. We hypothesize that the root of the northwestern Amazon craton was removed by upwelling of hot mantle material under the Guyana highlands. Temperature and density anomalies evident beneath the São Francisco craton appear to be connected with those of the Paranapanema craton, which could indicate a westward shift of its root. Depletion south of the Paranapanema Craton probably denotes remnants of a previously larger craton that was rejuvenated by the upwelling of hot mantle material leading to emplacement of the Paraná Flood Basalts.
Publications
Finger, N. P., Kaban, M. K., Tesauro, M., Haeger, C., Mooney, W. D., & Thomas, M. A (2021). Thermo‐Compositional Model of the Cratonic Lithosphere of South America. Geochemistry, Geophysics, Geosystems, e2020GC009307.
Finger N.-P., M. Kaban, M. Tesauro, C. Haeger, W. Mooney, and M. Thomas (2020). A Consistent Thermo-Compositional Model of the South American Cratonic Lithosphere from Integrated Inversion of Gravity and Seismic Data. General Assembly European Geosciences Union (4-8 May,Vienna 2020), https://doi.org/10.5194/egusphere-egu2020-22408.
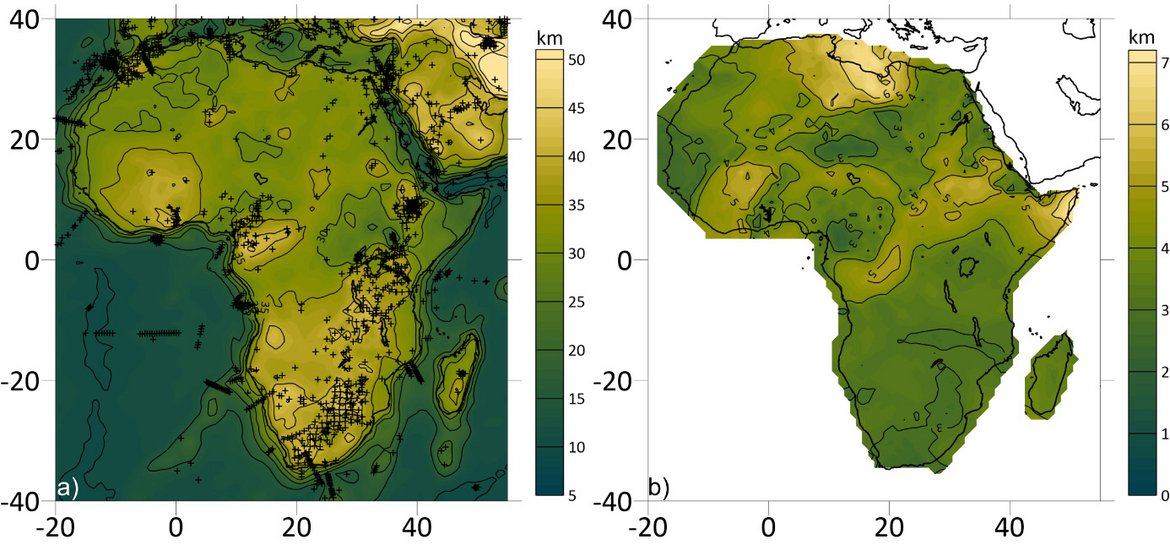
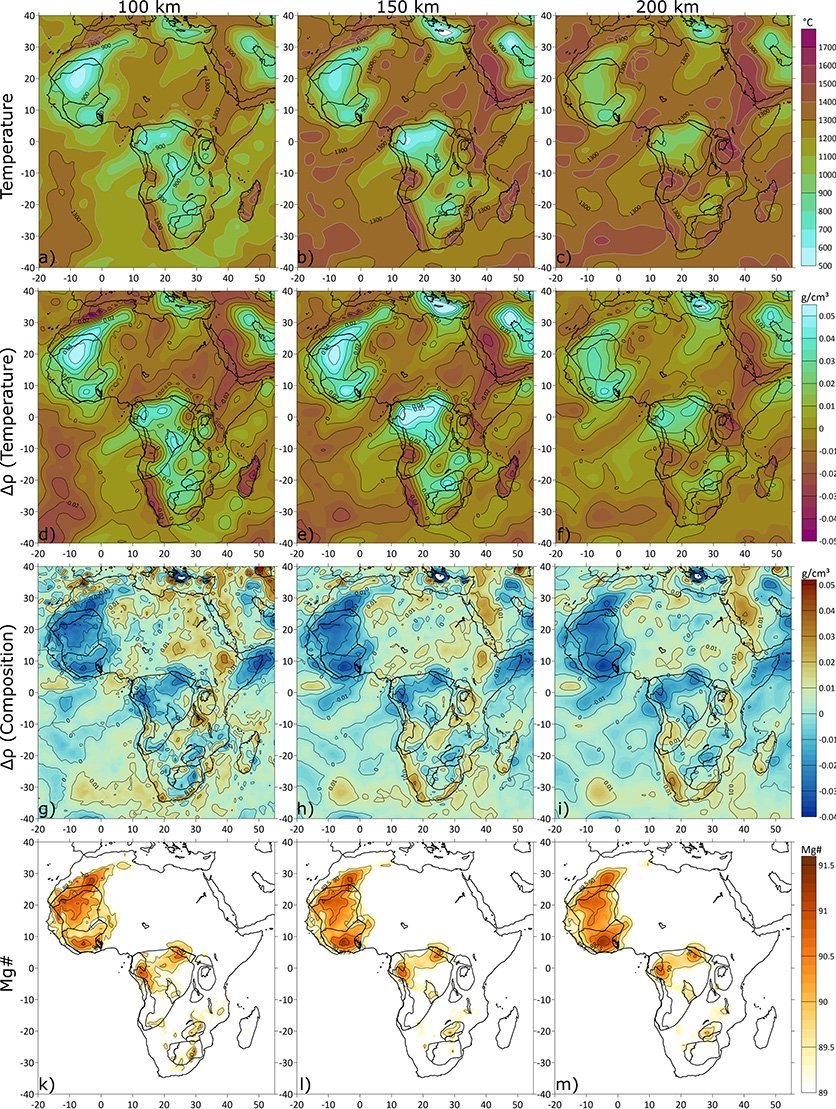
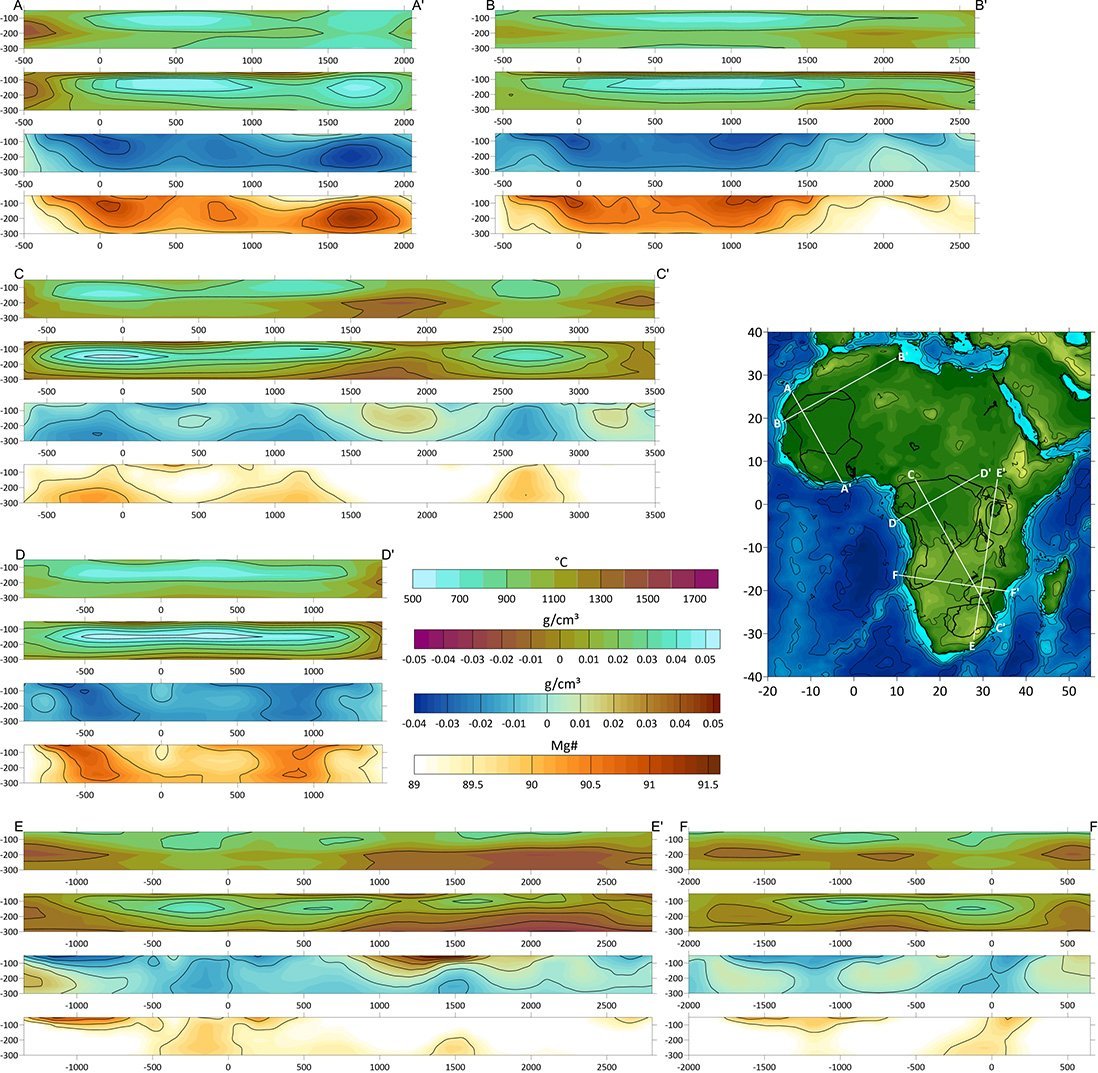
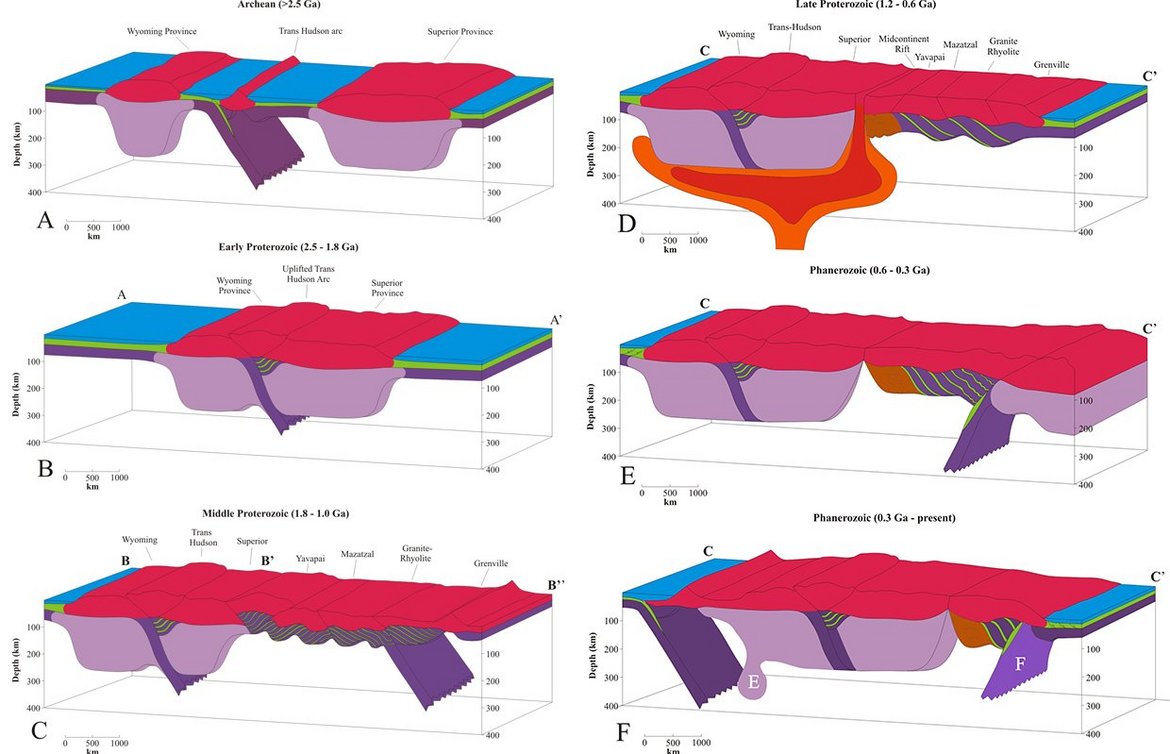
Recently, the continually increasing availability of seismic data has allowed high-resolution imaging of lithospheric structure beneath the African cratons. In this study, S-wave seismic tomography are combined with high resolution satellite gravity data in an integrated approach to investigate the structure of the lithosphere of Africa. A new model for the Moho depth (Fig. 1) and data on the crustal density structure are employed along with global dynamic models to calculate residual topography and mantle gravity residuals. Corrections for thermal effects of an initially juvenile mantle are estimated based on S-wave tomography and mineral physics. Joint inversion of the residuals yields necessary compositional adjustments that allow to recalculate the thermal effects. After several iterations, we obtain a consistent model of upper mantle temperature, thermal and compositional density variations, and Mg# as a measure of depletion, as well as an improved crustal density model (Figs. 2, 3). Our results show that thick and cold depleted lithosphere underlies West African, northern to central eastern Congo, and Zimbabwe Cratons. However, for most of these regions, the areal extent of their depleted lithosphere differs from the respective exposed Archean shields. Meanwhile, the lithosphere of Uganda, Tanzania, most of eastern and southern Congo, and the Kaapvaal Craton is thinner, warmer, and shows little or no depletion. Furthermore, the results allow to infer that the lithosphere of the exposed Archean shields of Congo and West African cratons was depleted before the single blocks were merged into their respective cratons.
Deep depleted roots are found under the West African, northern and central eastern Congo, and Zimbabwe cratons. They are absent or have been reworked at southern and easternmost Congo, Kaapvaal, Tanzania, and Uganda cratons. There is no evidence that the Bangweulu Block ever developed such a cratonic root.
Publications:
Finger, N. P., Kaban, M. K., Tesauro, M., Mooney, W. D., & Thomas, M. (2022). A Thermo‐Compositional Model of the African Cratonic Lithosphere. Geochemistry, Geophysics, Geosystems, 23(3), e2021GC010296, doi.org/10.1029/2021GC010296.
Finger, N. P., Kaban, M. K., Tesauro, M., Mooney, W. D., & Thomas, M. (2021, April). An integrated thermo-compositional model of the African cratonic lithosphere from gravity and seismic data. In EGU General Assembly Conference Abstracts (pp. EGU21-15215).
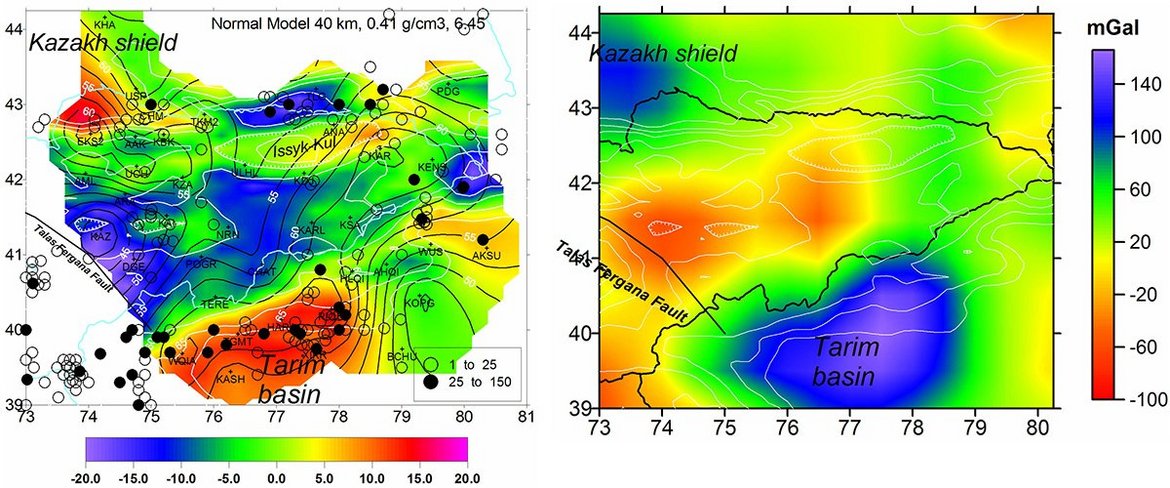
The tectonic structure of Asia is extremely complex and represents a result of interaction of various tectonic processes. Despite many studies providing geological and geophysical data for Asia, the existing models still do not explain completely deep structure, tectonic processes and dynamics of this extremely complicated region. The study of Central Asia was conducted within the framework of the Project CASE (KA-2669/2-1, DFG SPP 1257). In this study we integrate the new gravity field models from the combined satellite-terrestrial models, seismic data and geological data for modelling the density structure of the crust and upper mantle.
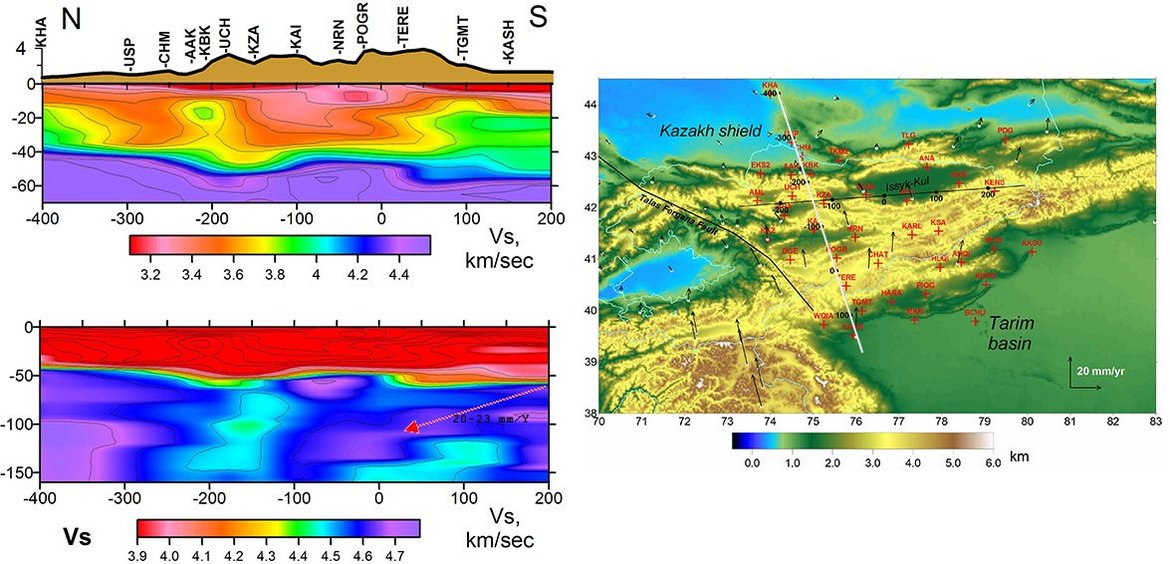
The main features of the obtained 3-D model are illustrated by the vertical cross-section to a depth of 200 km from Kazakh Shield in the North to Tarim Basin in the South.
The study of the Central Tien-Shan is continued within a framework of the project CASE (KA-2669/2-1, SPP 1257). In this study we integrate gravity data from the new combined satellite-terrestrial model, available seismic data, regional GPS observations and tectonics to model density structure of the crust and upper mantle and to understand style of the geodynamic processes responsible for high rate deformations in the region. Here we demonstrate selected preliminary results.
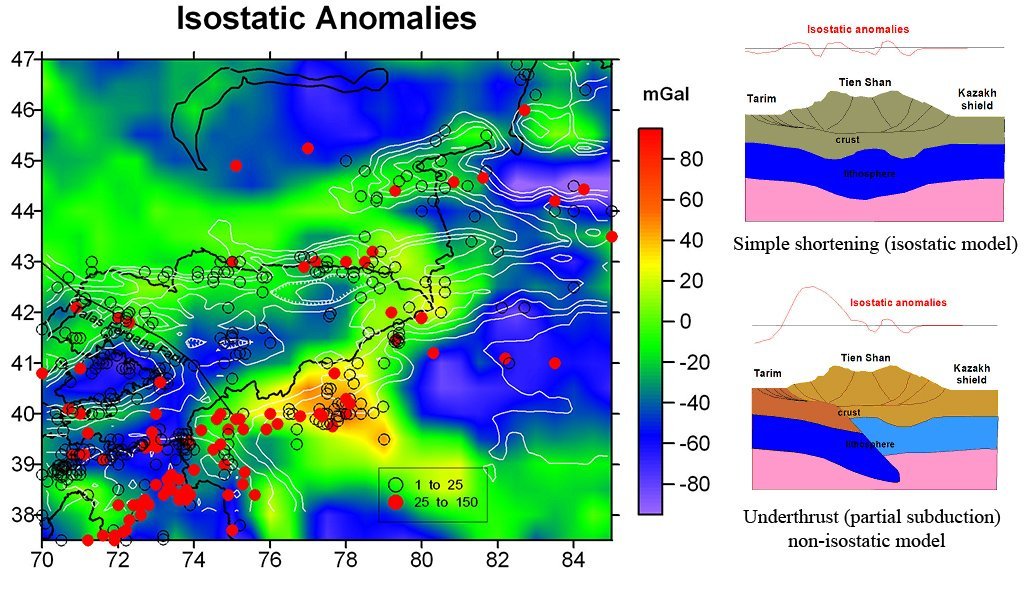
The existing models do not offer strong constraints on the lithospheric processes and geodynamics of Tien Shan. Several possible scenarios are usually discussed. The most popular model (Fig. 3-top) implies "simple" crustal shortening, which results from a strong compression between India and Eurasia. In contrast, the second model (Figure 3-bottom) implies partial underthrust (or continental subduction) of the Tarim lithosphere under Tien Shan. However, isostatic state of the lithosphere for these cases is principally different. Therefore, gravity modelling might be used to choose the right one.
A preliminary map of the isostatic anomalies has been computed for the Central Tien Shan. The result clearly shows that the model with underthrust of the Tarim plate under Tien Shan works much better: we found a strong positive anomaly on the southern flank of Central Tien Shan, which corresponds to the area with large crustal thickness and deep-seated earthquakes.
From a comparison of the new Moho map (Figure 1) and topography (Figure 2), one may see that correlation between these parameters is relatively low, which might also give preferences to the non-isostatic (subduction) model. To validate this assumption we calculate deflections of the observed Moho from the boundary, which should correspond to the local isostatic compensation of the crust (combined Airy-Pratt). We may conclude that the model with underthrusting of the Tarim plate under Tien Shan works much better (Figure 4).
We have found a strong negative mantle anomaly under Central Tien Shan, which indicates that the mantle under Central Tien Shan is likely hot. This is important conclusion; it supports the idea that this structure is an aborted rift, which was terminated by the collision between Indian and Eurasian lithospheric plates. In this case, the hot and mechanically weak lithosphere might be that factor, which stimulated growing of the Tien Shan ridge far away from the plate collision zone.
These are only preliminary results, the study is still in progress.
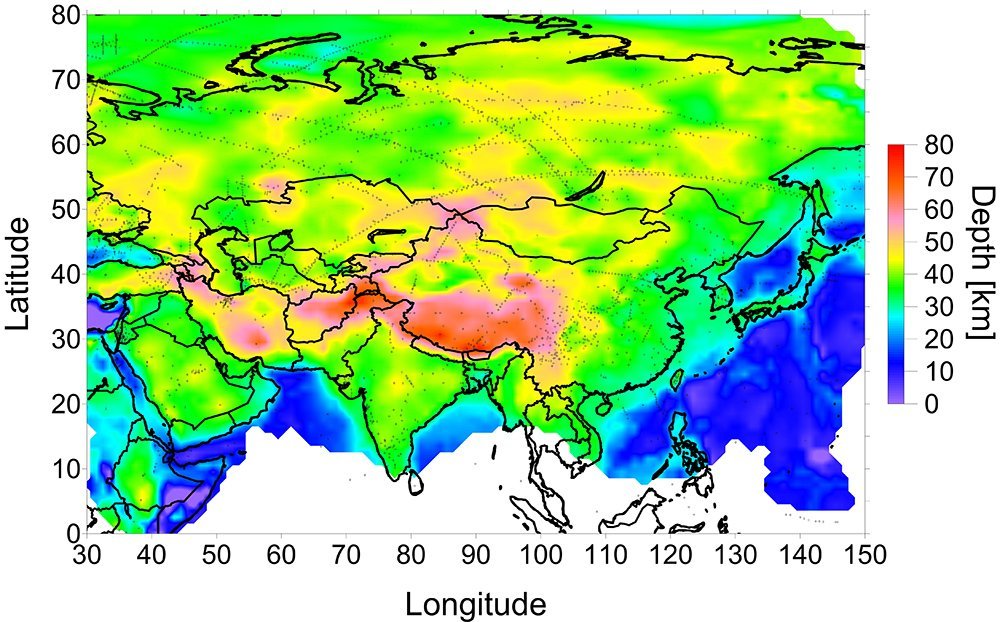
New crustal model for the whole Asia
Current crustal models are often unclear about the methodology and data that are used. Furthermore, differences in e.g. depth to Moho between previous models and current available data are often larger than 10km. It is with this in mind that a new methodology to obtain crustal models has been developed and applied to Asia (Stolk et al., 2011). The resulting new Moho estimate for Asia leads to a much better fit to the data, especially in Russia and Eastern China. The reliability of our estimation in these regions is confirmed by relatively low estimation uncertainties. Previous models have been unable to cater for locally varying velocity depth relations in Asia. Our model easily adapts to the data and brings out more crustal heterogeneities than before.
Publications:
- Stolk, W.; Kaban, M.K.; Tesauro, M.; Beekman, F.; Cloetingh, S. (2011): New Moho estimate and velocity model for Asia. General Assembly European Geosciences Union (Vienna, Austria 2011).
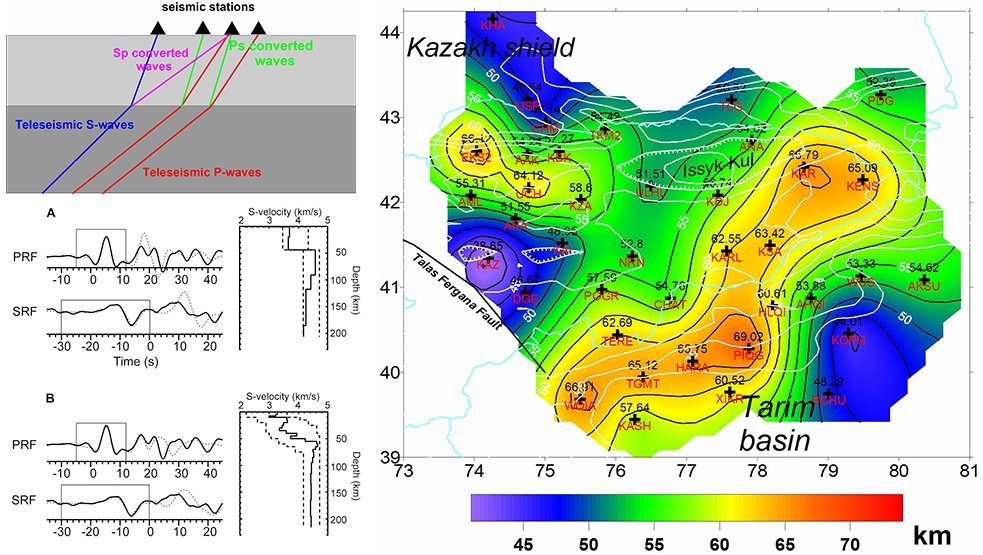
- Vinnik, L.; Aleshin, I.; Kaban, M.; Kosarev, G.; Oreshin, S.; Reigber, Ch. (2006): Deep structure of the Tien Shan imaged by receiver function tomography. - Physics of the Solid Earth, Vol. 42, No. 8, 639-651.
- Vinnik, L.; Reigber, Ch.; Aleshin, I.; Kosarev, G.; Kaban, M.; Oreshin, S.; Roecker, S., (2004): Receiver Function Tomography of the Central Tien Shan, Earth and Planetary Science Letters, 225/1-2, 131-146.
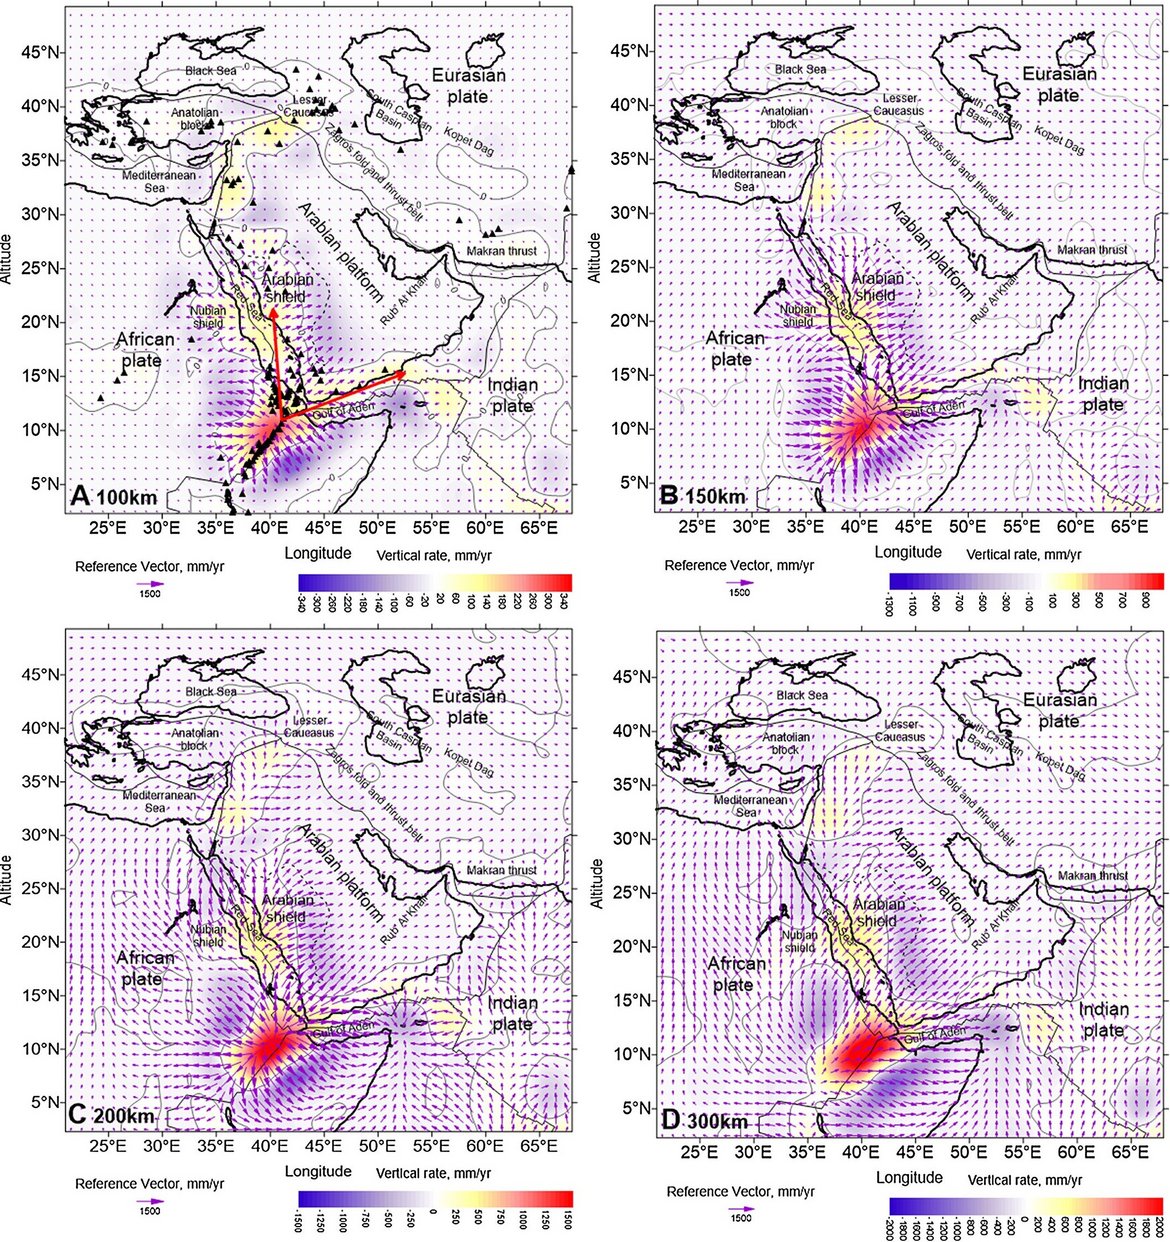
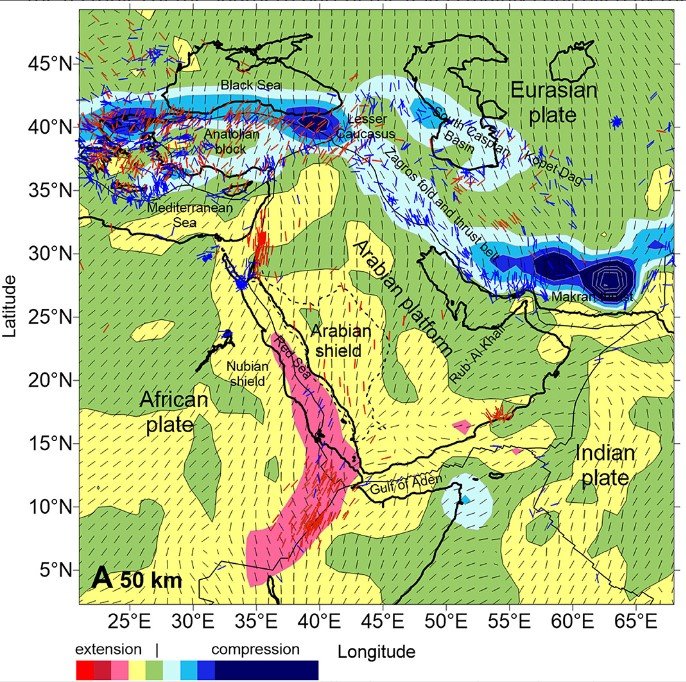
The Red Sea region is a highly populated area that is characterized by very active tectonics, which is responsible for earthquakes and geothermal activity. Mantle convection is one of the main driving forces that control plate tectonics at all levels. Therefore, modeling of the mantle convection can aid in understanding the origin and development of the tectonic processes in the region. The main difficulty in such modeling in the Middle East is that there exists a strong interplay of regional and global factors. To date, dynamic models for this region were based on low‐resolution global models. We present a novel dynamic model, which includes high‐resolution density and viscosity distributions as well as weak plate boundaries, which are embedded in the global convection model. Mantle flow velocities and principal stress directions were thus estimated for the lithosphere and upper mantle in the region. The resulting mantle flow patterns show a clear distinction in tectonics of three different parts of the Red Sea Valley. Furthermore, the stress orientations explain the fault structures in the Red Sea Basin.
References:
Petrunin, A. G., Kaban, M. K., El Khrepy, S., & Al‐Arifi, N. (2020). Mantle convection patterns reveal the mechanism of the Red Sea rifting. Tectonics, 39(2), e2019TC005829.
Becker, T. W., Lebedev, S., & Long, M. D. (2012). On the relationship between azimuthal anisotropy from shear wave splitting and surface wave tomography. Journal of Geophysical Research: Solid Earth, 117(B1).
Wüstefeld, A., Bokelmann, G., Barruol, G., & Montagner, J. P. (2009). Identifying global seismic anisotropy patterns by correlating shear-wave splitting and surface-wave data. Physics of the Earth and Planetary Interiors, 176(3-4), 198-212.
MANTIS und die Fortsetzung MANTIS II sind Projekte im DFG-Schwerpunktprogramm SPP1788 DynamicEarth.
Der antarktische Kontinent ist fast vollständig von einer dicken Eisschicht bedeckt, die klassische In-situ-Messungen behindert. Es bleibt daher eines der geophysikalisch gesehen am wenigsten bekannten Gebiete der Erde. Über die Struktur und die thermischen und rheologischen Eigenschaften der Lithosphäre ist wenig bekannt. Da der Zustand der Lithosphäre stark mit oberflächennahen Prozessen wie der Eisdynamik oder der glazialisostatischen Anpassung (GIA) sowie dem tieferen, konvektierenden Mantel zusammenhängt, ist die Kenntnis dieser Eigenschaften bei der Modellierung der gekoppelten Systeme von entscheidender Bedeutung. Ziel dieses Projekts ist es, ein umfassendes Modell der antarktischen Lithosphäre in Bezug auf Stärke, Temperatur, Dichte und Zusammensetzung zu erstellen und die Wechselwirkungen der Lithosphäre mit der Eisdecke darüber und dem Mantel darunter zu modellieren.
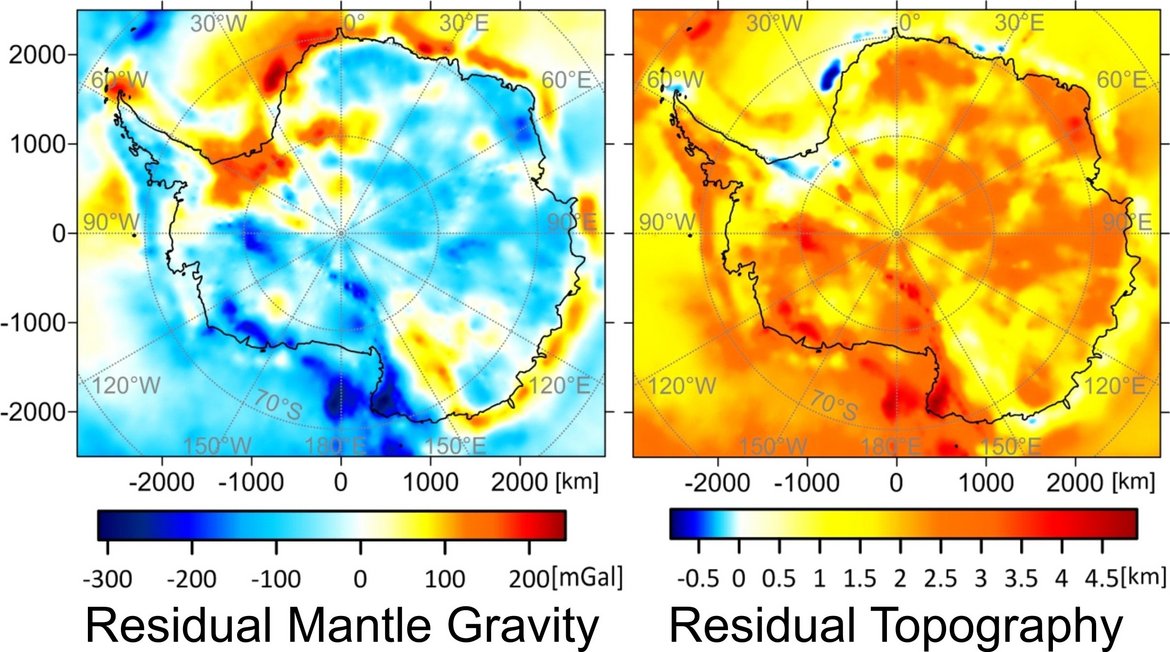
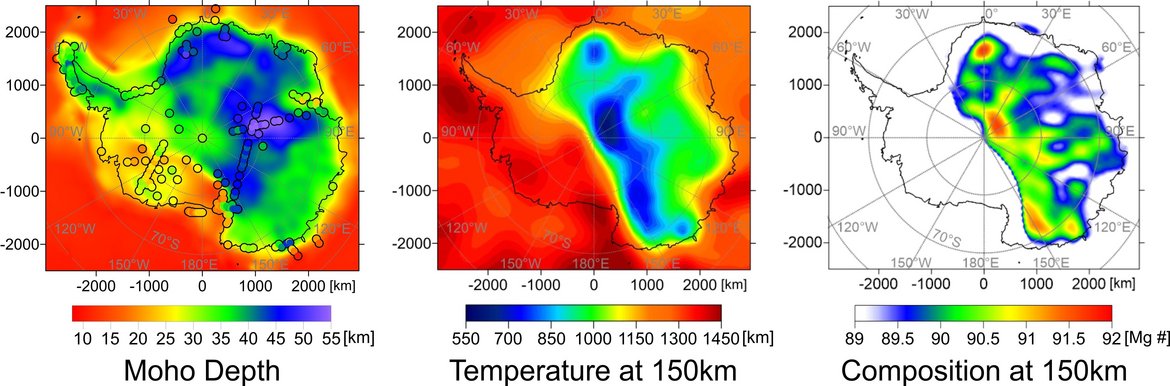
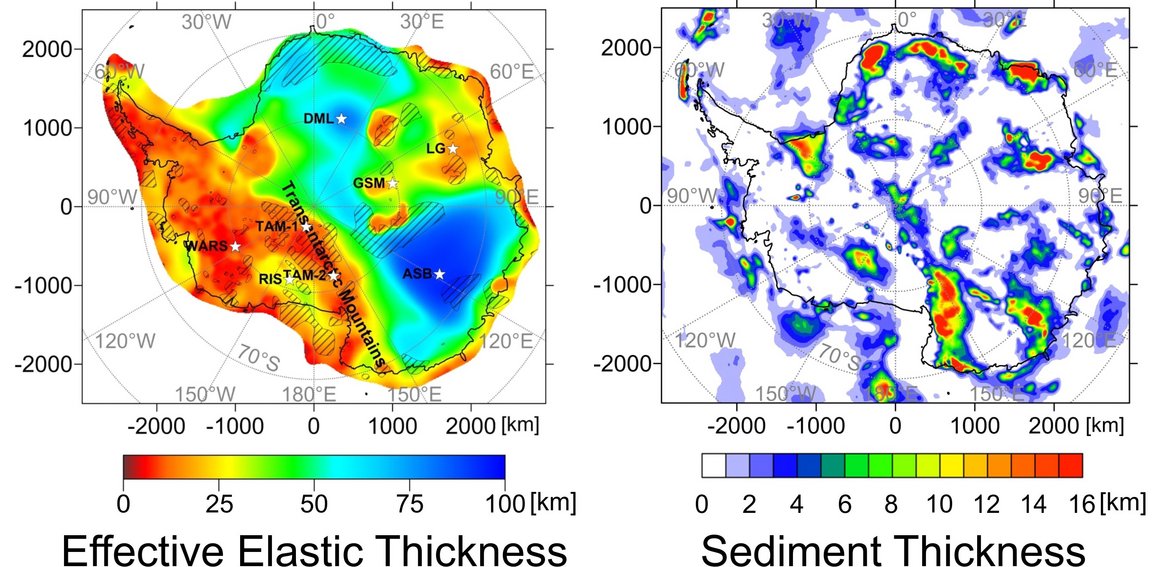
In diesem Projekt haben wir iterativ Schwerkraft-, Topographie- und seismische Tomographiedaten, die durch mineralphysikalische Gleichungen eingeschränkt wurden, in einem gemeinsamen Inversionsschema kombiniert, um ein 3D-Dichte-, Temperatur- und Zusammensetzungsmodell der antarktischen Lithosphäre zu entwickeln. Seismische Daten zu Krustenstrukturen wurden außerdem verwendet, um ein neues Moho- und Krustendichtemodell zu erstellen. Als Maß für die Stärke wurde zusätzlich die effektive elastische Dicke Te durch Kreuzspektralanalyse des Schwerefeldes mit der eingestellten Topographie abgeleitet. Die Fan-Wavelet-Technik wurde verwendet, um erstmals Variationen von Te über den gesamten Kontinent mittels Admittanz- und Kohärenzanalyse zu berechnen. Um die Strukturen und Eigenschaften der oberen Kruste zu untersuchen, wurden Korrekturen des Schwerkrafteffekts der isostatischen Kompensation geologischer Lasten auf die isostatischen Schwerefeldanomalien angewendet. Die resultierenden sogenannten dekompensativen Schwerkraftanomalien können verwendet werden, um Informationen über Sedimentverteilungen abzuleiten, die zuvor unter der Eisdecke verborgen waren, wobei negative Anomalien wahrscheinlich durch Sedimente geringer Dichte verursacht werden.
Eine allgemeine Aufteilung der antarktischen Lithosphäre wird durch alle untersuchten Parameter bestätigt. Während die Ostantarktis (EANT) durch eine alte, dicke, starke und kalte Lithosphäre gekennzeichnet ist, hat die Westantarktis (WANT) erst im Känozoikum ihre heutige Form erreicht und weist daher eine viel dünnere, schwächere und heißere Lithosphäre auf. Ein Übergang ist entlang der transantarktischen Berge sichtbar. Ob die Bergkette zu WANT oder EANT gehört, ist fraglich, aber insbesondere die Abschätzungen von Te deuten auf eine engere Verbindung zu WANT hin. Abgesehen von dieser allgemeinen Unterteilung wurde innerhalb von EANT eine lithosphärische Fragmentierung entdeckt. Im Dronning Maud Land, im Wilkes Land und in der Nähe des Südpols wurden kratonische Fragmente präkambrischen Ursprungs mit hoher Verarmung, niedrigen Temperaturen und hoher Te nachgewiesen. Die beiden letzteren sind wahrscheinlich Teil des Mawson-Kratons. Eine lithosphärische Schwächung in Kombination mit einem fast primitiven oberen Mantel besteht im Lambert-Graben und war wahrscheinlich das Ergebnis von Riftaktivität im ostantarktischen Rift-System. Die erhaltenen dekompensativen Schwerkraftanomalien entsprechen gut bekannten Sedimentbecken wie dem Lambert Graben und dem Filchner-Ronne-Eisschelfs. Sie deuten auch auf große Sedimentablagerungen hin, die zuvor nicht nur spärlich kartiert wurden.
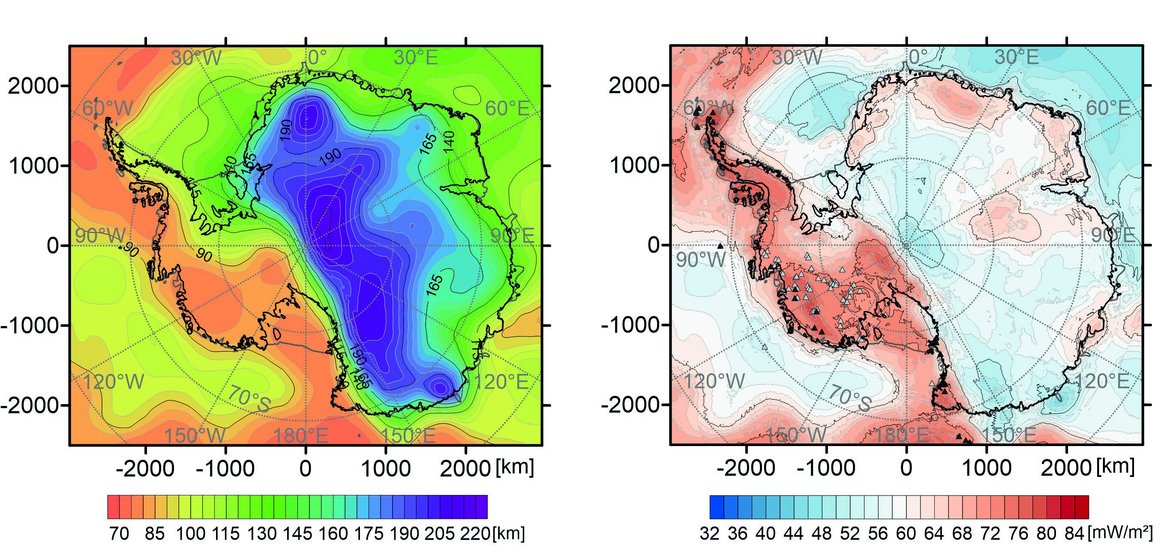
Die erste Phase dieses Projekts liefert ein umfassendes Modell der Lithosphäre der Antarktis. Das System Erde besteht jedoch nicht aus statischen, unabhängigen Schichten, sondern stellt ein komplexes System interagierender dynamischer Teilsysteme dar. Ein solides Verständnis jeder dieser Schichten ist erforderlich, um die dynamischen Prozesse zu verstehen, die sie miteinander verbinden. Das bereitgestellte lithosphärische Modell ist daher eine Grundlage für die weitere Analyse seiner Kopplung mit den Prozessen des tiefen Mantels und der Oberfläche. So erleichtert das thermische Modell die Modellierung des Wärmeflusses an der Oberfläche, die Bestimmung der thermischen Lithosphären-Asthenosphären-Grenze (LAB) und - kombiniert mit Dichtevariationen - die Abschätzung der Viskosität des oberen Mantels. Diese Parameter sind entscheidend für die Modellierung von Oberflächen- und oberflächennahen Prozessen wie Eisdynamik und GIA. Die Bestimmung des geothermischen Wärmeflusses ist nach wie vor eine Herausforderung, da nur wenige In-situ-Daten vorliegen und geophysikalische Modelle große Diskrepanzen in Bezug auf Amplitude und Auflösung aufweisen, insbesondere auf regionaler Ebene. Auf der Grundlage unseres Temperaturmodells bestimmen wir die thermische LAB, die als 1300°C-Isotherme definiert ist, und verwenden sie anschließend als untere Randbedingung zur Berechnung der 1D-Gleichung für den stationären Wärmefluss für jeden Gitterpunkt. Auf diese Weise erhalten wir ein verbessertes thermisches 3D-Modell der Lithosphäre und der Kruste sowie eine neue Verteilung des geothermischen Wärmeflusses an der Oberfläche. Sowohl die lithosphärische Dicke als auch der GHF spiegeln die oben erwähnte Zweiteilung der Antarktis wider. Die tiefen lithosphärischen Wurzeln und die in EANT beobachtete GHF von 50 bis 60 mW/m² liegen innerhalb des normalen Bereichs für kratonische Regionen präkambrischen Ursprungs. In WANT stimmen der hohe GHF-Wert und die dünne Lithosphäre gut mit dem jüngeren tektonischen Alter dieser Region überein. Ein genauerer Blick auf die regionalen Schwankungen des neuen GHF-Modells zeigt eine bessere Übereinstimmung mit der jüngsten tektonischen und vulkanischen Aktivität sowie mit erhöhtem Eisabfluss.
Publikationen:
Chen, B., Haeger, C., Kaban, M. K., & Petrunin, A. G. (2018). Variations of the effective elastic thickness reveal tectonic fragmentation of the Antarctic lithosphere. Tectonophysics, 746, 412–424. doi.org/10.1016/j.tecto.2017.06.012
Haeger, C., Kaban, M. K., Tesauro, M., Petrunin, A. G., & Mooney, W. D. (2019). 3D density, thermal and compositional model of the Antarctic lithosphere and implications for its evolution. Geochemistry, Geophysics, Geosystems, (2005), 1–20. doi.org/10.1029/2018GC008033
Haeger, C., & Kaban, M. K. (2019). Decompensative Gravity Anomalies Reveal the Structure of the Upper Crust of Antarctica. Pure and Applied Geophysics, 176(10), 4401–4414. doi.org/10.1007/s00024-019-02212-5
Haeger, C., Petrunin, A. G. & Kaban, M.K. (2022). Heat flow in Antarctica: Can it influence ice dynamics? Geochemistry, Geophysics, Geosystems, in review.
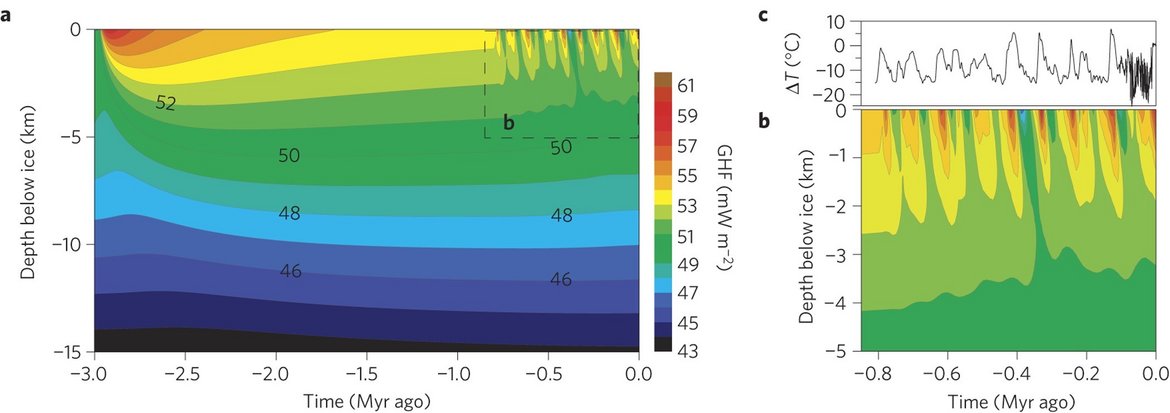
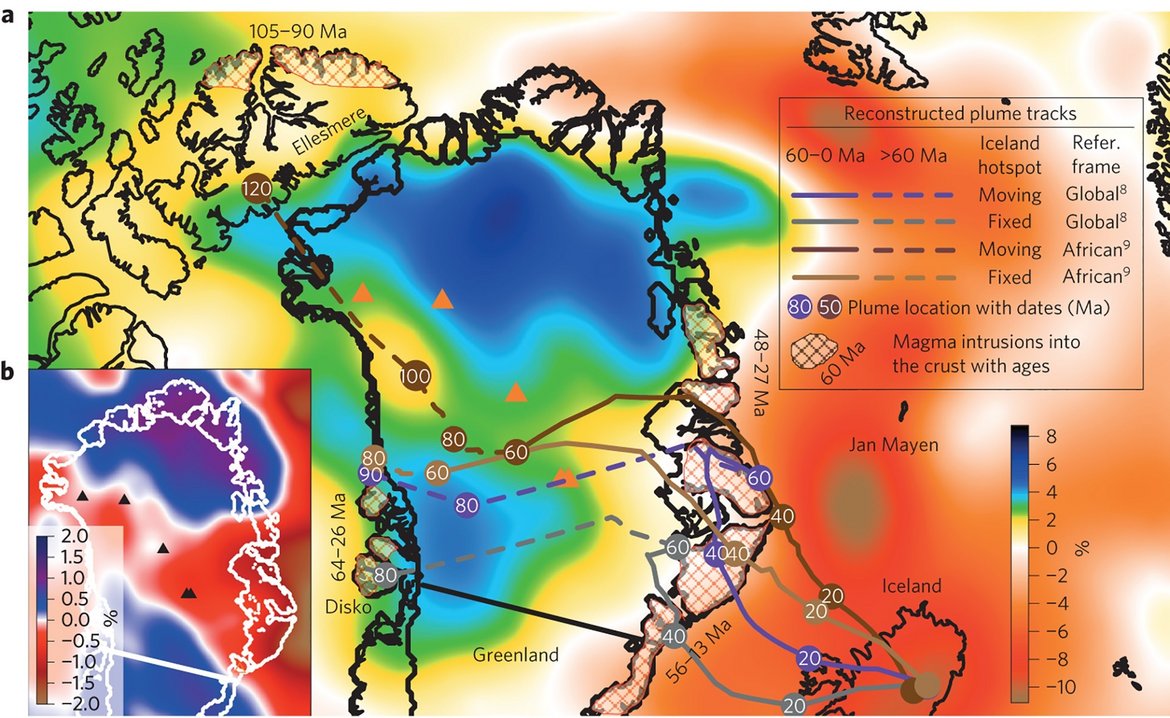
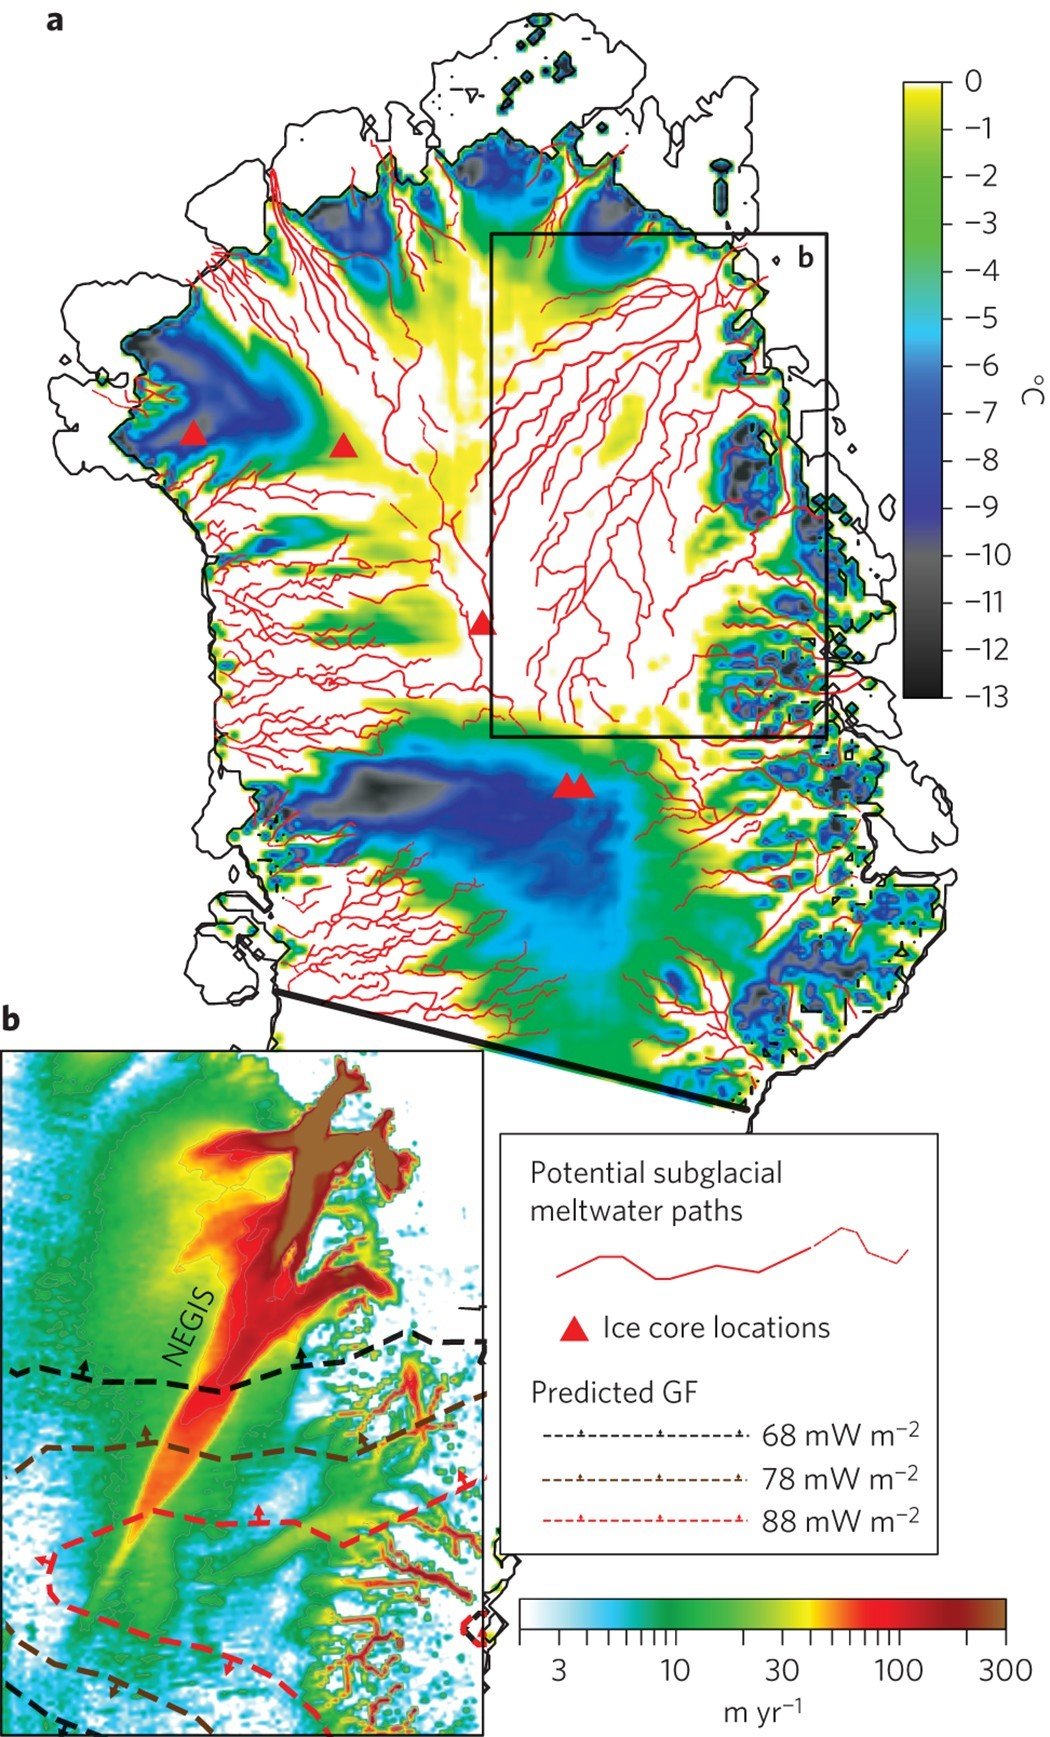
Ice-penetrating radarand ice core drilling have shown that large parts of the north-central Greenland ice sheet are melting from below. It has been argued that basal ice melt is due to the anomalously high geothermal flux that has also influenced the development of the longest ice stream in Greenland. In this study we estimated the geothermal flux beneath the Greenland ice sheet and identify a 1,200-km-long and 400-km-wide geothermal anomaly beneath the thick ice cover. We suggest that this anomaly explains the observed melting of the ice sheet’s base, which drives the vigorous subglacial hydrology and controls the position of the head of the enigmatic 750-km-long northeastern Greenland ice stream. Our combined analysis of independent seismic, gravity and tectonic data implies that the geothermal anomaly, which crosses Greenland from west to east, was formed by Greenland’s passage over the Iceland mantle plume between roughly 80 and 35 million years ago. We conclude that the complexity of the present-day subglacial hydrology and dynamic features of the north-central Greenland ice sheet originated in tectonic events that pre-date the onset of glaciation in Greenland by many tens of millions of years.
References:
Petrunin, A. G., Rogozhina, I., Vaughan, A. P. M., Kukkonen, I. T., Kaban, M. K., Koulakov, I., & Thomas, M. (2013). Heat flux variations beneath central Greenland’s ice due to anomalously thin lithosphere. Nature Geoscience, 6(9), 746-750.
Rogozhina, I., Petrunin, A. G., Vaughan, A. P., Steinberger, B., Johnson, J. V., Kaban, M. K., ... & Koulakov, I. (2016). Melting at the base of the Greenland ice sheet explained by Iceland hotspot history. Nature Geoscience, 9(5), 366-369.
The aim of this subtopic is to construct a comprehensive global model of the crust and upper mantle and to determine the impact of the lithosphere on the observed gravity field. To solve this problem we use a joint analysis of the gravity field/geoid with seismic P-, and S-velocities, surface topography, heat flow and other geophysical and mineral-physics data.

We use a joint analysis of the gravity field/geoid with seismic (P-, S-velocities), surface topography, heat flow and other geophysical and mineral-physics data, which are integrated into a comprehensive global model of the crust and upper mantle. Density anomalies resulted from temperature and compositional variations represent one of the main driving forces of the tectonic processes. Rheological properties of the lithosphere are other principal constraints, which are required for quantitative modelling of the dynamic processes. Therefore, the results obtained by the integration of these parameters can be used to forecast the future behavior of entire geological systems, as well as of specific subsurface geological features. The aim of this research is to be reached through several steps, as displayed in Fig.1 and some results are demonstrated below. The thermal and rheological models are demonstrated in the next part.
The Earth crust is the most heterogeneous layer, it completely masks the effects of deep seated heterogeneities, especially in the observed gravity field. Crustal models primarily based on existing reflection and refraction seismic profiles are used to reduce these effects ‘before hand’. In cooperation with the U.S. Geological Survey (Walter D. Mooney) we develop a new global high resolution (1°x1°) crustal model. One example is the Moho map, which is principally improved in several regions: North America, Eurasia and Australia (e.g., Tesauro et al., 2008; Mooney and Kaban, 2010; Stolk et al., 2012). Other regions are covered by the CRUST2.0 model (Bassin et al., 2000). Other parameters of the crust have also been revised using these new datasets. For example, the global map of the sedimentary thickness includes new compilations for the continents (Tesauro et al., 2008; Mooney and Kaban, 2010) and for the oceans (NOAA, 2010).
: Depth to Moho (from zero level).")
: thickness of sediments.")
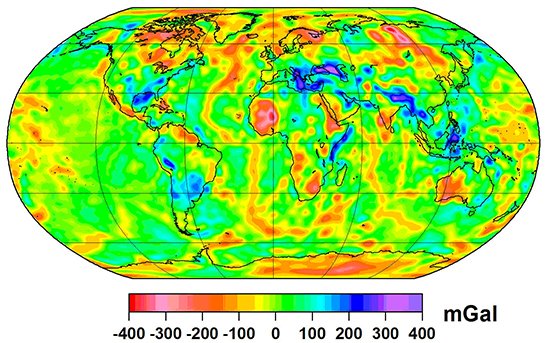
In the next stage we have computed the gravity field induced by the crustal density inhomogeneities and removed it from the observed gravity field and from the observed topography. The residual "mantle" anomalies display mantle density heterogeneity. All active tectonic centers and main plate boundaries are also reflected in this map.
: Residual mantle anomalies")
: Residual topography adjusted to the density 1 g/cm3 after removing of the effect of the crust")
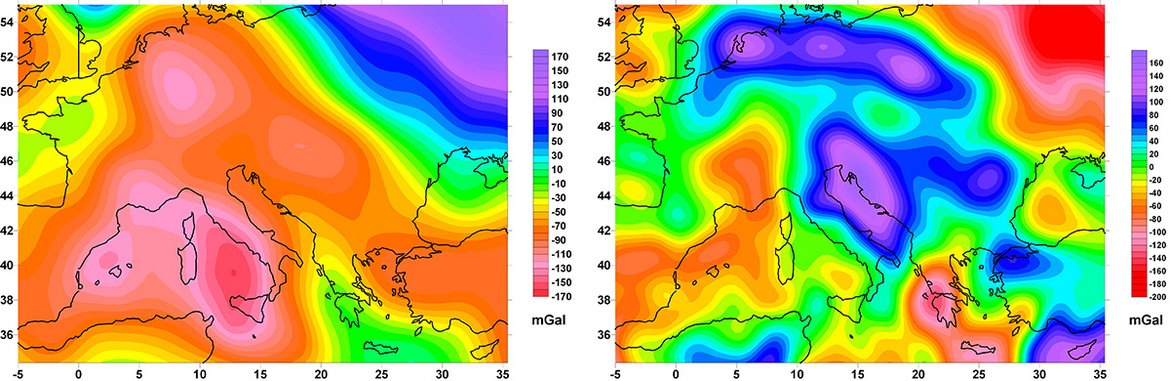
The next problem is to discriminate between the effects of thermal and compositional variations, therefore to locate temperature and chemical variations in the mantle. This goal can be achieved via a joint analysis of the mantle anomalies with seismic, geothermal and mineral physics data. As a result we get these two maps, which show the gravity effect of thermal and compositional anomalies in the upper mantle.
 and compositional (re) variations in the upper mantle.")
Starting with global Earth's gravity, topography and crustal models, isostatic gravity anomalies and geoid undulations have been determined. The initial crust and upper mantle density structure has been corrected in a least squares adjustment using gravity and seismic tomography data. The calculated residual geoid undulations more realistically describe the signals from mantle convection and deep density inhomogeneities than the observed geoid.
: The observed geoid, combined CHAMP-GRACE-GOCE-terrestrial model (terms C20 and C40 are removed).")
: The effect of the isostatically compensated lithosphere.")
: The residual geoid (isostatic anomalies), which reflects the effects of the deep mantle structure and surface dynamic topography generated by the mantle convection flow.")
Literatur
- Kaban, M.K., Schwintzer, P.; Tikhotsky, S.A. (1999): Global isostatic residual geoid and isostatic gravity anomalies.: Geophys. J. Int., 136, 519-536.
- Kaban, M.K.; Schwintzer, P. (2001): Oceanic upper mantle structure from experimental scaling of VS and density at different depths. Geophys. J. Int. 147, 199–214.
- Kaban, M.K.; Schwintzer, P.; Reigber, C. (2004): Signaturen des Erdmantels im Schwerefeld der Erde, Zweijahresbericht Geoforschungszentrum Potsdam 2002/2003, Geoforschungszentrum, 119-125.
- Kaban, M.K.; Schwintzer, P.; Artemieva, I.M.; Mooney, W.D., (2003): Density of the continental roots: compositional and thermal contributions. Earth and Planetary Science Letters, 209, 53-69.
- Kaban, M.K.; Schwintzer, P.; Reigber, C., (2004): A new isostatic model of the lithosphere and gravity field, Journal of Geodesy 78, 368-385.
- Kaban, M.K.; Schwintzer, P.; Reigber, C. (2005): Dynamic topography as reflected in the global gravity field. - In: Reigber, C., Lühr, H., Schwintzer, P., Wickert, J. (Eds.), Earth observation with CHAMP : Results from Three Years in Orbit, Springer, 199-204.
- Kaban, M.K.; Tesauro, M.; Cloetingh, S. (2010): An integrated gravity model for Europe's crust and upper mantle. Earth Plan. Sci. Let. doi:10.1016/j.epsl.2010.04.041.
- Mooney, W.D; Kaban, M.K., (2010): The North American Upper Mantle: Density, Composition, and Evolution, J. Geophys. Res., 115, B12424, doi: 10.1029/2010JB000866.
- Tesauro, M.; Kaban, M.K.; Cloetingh, S.A.P.L. (2012): Global strength and elastic thickness of the lithosphere, Glob. Planet. Change (2012), doi:10.1016/j.gloplacha.2011.12.003.
Thermal, rheological and strength models
In this subtopic we present the first global strength and effective elastic thickness maps, which are determined using physical properties from recent crustal and lithospheric models. Temperature variations in the lithosphere are derived from seismic velocities using a mineral-physics approach with additional constraints from geothermal modelling.
Temperature is one of the key parameters controlling lithospheric dynamics and rheology. Up to now, the temperature distribution is directly determined only in the shallowest part of the crust (0-5 km). Temperature estimates for the deeper horizons, where the heat transport is mostly conductive, require a precise knowledge of many crustal parameters (chiefly thermal conductivity and heat production), which are extremely uncertain. Therefore, indirect approaches are often used to determine temperature distributions within crust and mantle. We derive a global temperature distribution in the lithosphere by inverting the S-wave tomography model of Ritsema et al. 2004 and 2011. In the mineral physics approach (Cammarano et al., 2003) we take into account the anharmonic and anelasticity effects for various composite mineralogies at different P-T conditions. Temperatures estimated at a depth of 100 km (Fig. 1) show strong lateral variability in the continents.
, depth 100 km")
Strength of the lithosphere, or maximum stress it can support before failing, has been debated since the beginning of the last century (Barrell, 1914) because its spatial and temporal variations are key in geodynamics. The strength of the lithosphere is controlled by its depth-dependent rheological structure, which depends on thickness of different layers, composition and thermal properties (Figure 2). Also fluids and strain rate play an important role.

 and thermal estimations (right) to the lithosphere strength (bottom): conceptual make-up adopted for the calculation of 3D strength models")
The total strength of the lithosphere has been estimated worldwide using physical properties from recent crustal, rheological and thermal models (Tesauro et al., 2012a-b). Pronounced differences of the strength and elastic plate thickness of the lithosphere are found between the old cratons and the areas affected by Tertiary volcanism, which also coincides with the boundaries of seimogenic zones (Figure 4). Lithospheric strength is primarily controlled by the crust in the young (Phanerozoic) geological provinces, while in the old (Achaean and Proterozoic) cratons strength is primarily concentrated in the lithospheric mantle.
 in compressional stress conditions (Tesauro et al., 2012b)")
 of the lithosphere (km) based on the Yield strength envelope (Tesauro et al., 2012b)")
Literatur
- Kaban, M.K.; Schwintzer, P.; Artemieva, I.M.; Mooney, W.D., (2003): Density of the continental roots: compositional and thermal contributions. Earth and Planetary Science Letters, 209, 53-69, doi:10.1016/S0012-821X(03)00072-4 .
- Tesauro, M.; Kaban, M.K.; Cloetingh, S.A.P.L. (2012a): Global strength and elastic thickness of the lithosphere, Global and Planetary Change, 90–91, 51–57, doi:10.1016/j.gloplacha.2011.12.003.
- Tesauro, M.; Kaban, M.K.; Cloetingh, S.A.P.L. (2012b): Global model for the lithospheric strength and effective elastic thickness. Tectonophysics, 602, 78-86, doi: 10.1016/j.tecto.2013.01.006 .
- Tesauro, M.; Audet, P.; Kaban, M.K., Bürgmann, R.; Cloetingh, S.A.P.L. (2012): The effective elastic thickness of the continental lithosphere: Comparison between rheological and inverse approaches. Geochemistry, Geophysics, Geosystems (G3), 13, 9, Q09001, doi:10.1029/2012GC004162.
Snap-shot (instantaneous) dynamic model of the mantle
We are going to construct a new global dynamic model of the mantle and to describe internal dynamic processes that strongly influence the Earth's surface. A principal improvement compared to previous studies should be a comprehensive model of the transition zone (TZ) and determination of its effect on the global mantle convection, dynamic geoid and plate velocities. Another principal step-forward will be a 3D viscosity model of the mantle, the parameters of which will be tuned to provide best fit to the observed fields (geoid, dynamic topography, plate velocities).
Density structure of the mantle transition zone and the dynamic geoid
Joint inversion of the observed geoid and tomography models of seismic velocities has been commonly used to constrain mantle properties and convection flow. However, most of the employed tomography models have been obtained without considering the effect of the mantle transition zone (TZ). We use the new-generation tomography model of Gu et al. (2003), in which seismic velocity perturbations are estimated together with depth variations of the main TZ discontinuities.
: Vs perturbations at a depth of 650 km.")
: Depth to the 660 transition zone boundary")
In the inversion of this model with the observed geoid the velocity-to-density scaling factor and density jump at these discontinuities are determined simultaneously. By this, the mantle flow across TZ is defined self-consistently: the undulations of the TZ boundaries suppress or accelerate mantle currents depending on the determined density contrast. For the 410-km discontinuity we obtain the scaling factor and density jump, which are close to mineral physics predictions. Therefore, we conclude that these effects are decoupled in the tomography model. In contrast, the calculated density jump at the 660 discontinuity is approximately 4 times less than the PREM value. We suggest that this is the effect of multiple phase transitions within a depth range of 640-720 km.
: Velocity-to-density scaling factors determined in the joint inversion of the geoid and S-wave velocity variations: (solid) for the combined model (Gu et al., 2003) including the TZ boundaries; (dashed) for the previous S20a model (Ekstrom and Dz...")
Under normal thermal conditions, the post-spinel phase transformation is relatively sharp (~5 km) and clearly visible in seismic models. On the other hand, the transition of majorite garnet to perovskite is much broader (up to ~ 50 km) and, therefore hardly detectable. Due to the different sign of the Clapeyron slope, the total gravity effect is drastically decreased. To fit the obtained results, the required value of the Clapeyron slope for the majorite garnet to perovskite transformation should be equal to about +1.7 МPa/К. In the cold zones the same effect might be produced by the transition from ilmenite to perovskite at 610-640 km depth, which is in agreement with multiple reflections revealed in regional seismic studies near the bottom of TZ (Deuss et al., 2005). The estimated amplitude of the mantle flow across TZ is about ± 20 mm/y, which corresponds to the whole-mantle convection scheme.
")
One of the principal features of the model is the low-viscosity zone right above the 660 discontinuity, so called “notch”, which is required to provide best fit between the observed and calculated geoid. Before, this feature was typically recognized by postglacial rebound studies (e.g. Milne et al., 1998). In fact, it serves like a barrier between the upper and lower mantle, which significantly reduces the dynamic topography induced by lower mantle heterogeneity and, as a result, affects the dynamic geoid.
The calculated geoid better fits to the observed one than the obtained without considering the TZ effect.
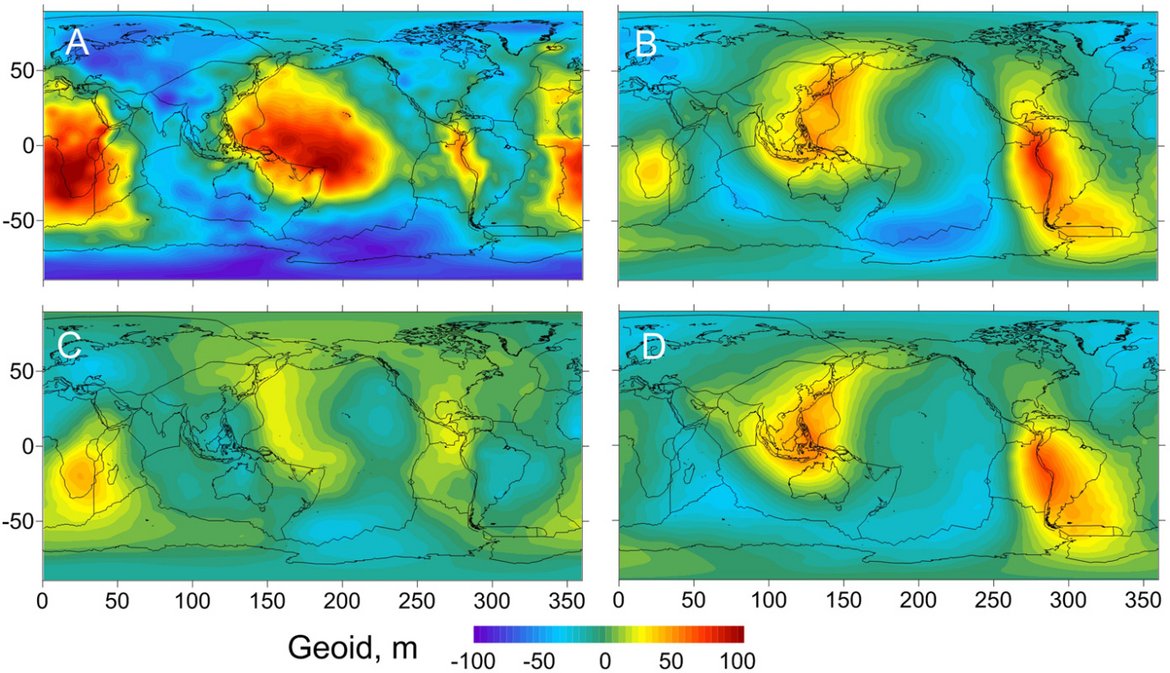
: Observed geoid with the effect of the crust and upper mantle removed. (B): Geoid obtained with the s20s model without TZ boundaries (Ekstrom and Dziewonski, 1998). (C): Geoid based on the joint inversion with the combined model (Gu et al., 2003)...")
Literatur
- Kaban, M.K.; Trubitsyn, V. (2012): Density structure of the mantle transition zone and the dynamic geoid. Journal of Geodynamics, Vol. 59-60, 183-192, doi:10.1016/j.jog.2012.02.007.
- Trubitsyn, V.; Kaban, M.K.; Rothacher, M. (2008): Mechanical and thermal effects of floating continents on the global mantle convection. Phys. of the Earth and Plan. Inter., Vol. 171, 313–322, doi:10.1016/j.pepi.2008.03.011.
- Trubitsyn, V.P.; Rogozhina, I.E.; Kaban, M.K. (2008): On a spectral method of solving the Stokes equation. Physics of the Solid Earth, Vol. 44, No. 1, 18-25, doi:10.1007/s11486-008-1003-4.
- Kaban, M.K.; Rogozhina, I.; Trubitsyn, V. (2007): Importance of lateral viscosity variations in the whole mantle for modelling of the dynamic geoid and surface velocities, Journal of Geodynamics., Vol. 43, No. 2, 262–273, doi:10.1016/j.jog.2006.09.020.
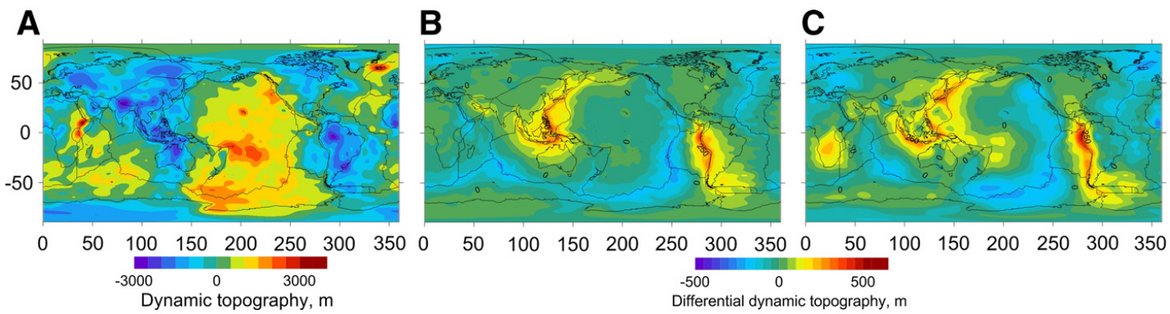
A joint effect of weak zones, dividing lithospheric plates, and lateral viscosity variations (LVV) in the whole mantle on the observed geoid is investigated by a new numerical approach. This technique is based on the substantially revised method introduced by Zhang and Christensen (1993) for solving the Navier–Stokes–Poisson equations in the spectral domain with strong LVV. Weak plate boundaries (WPB) are introduced based on an integrated global model of plate boundary deformations GSRM (Kreemer et al., 2003). The effect of WPB on the geoid is significant and reaches −40 to 70 m with RMS ~20 m. The peaks are observed over large subduction zones in South America and the southwestern Pacific in agreement with previous studies. The positive geoid anomaly in South America could be explained largely by a dynamic effect of decoupling of the Nazca and South American plates. The negative changes of the geoid mostly relate to mid-oceanic ridges. The amplitude of the effect depends on the viscosity contrasts at WPB compared with the plate viscosity until its value reaches the limit of 2.5–3 orders of magnitude. This value might be considered as a level at which the plates are effectively decoupled. The effect of WPB exceeds the effect of LVV in the whole mantle and generally does not correlate with it. However, inclusion of LVV reduces the geoid perturbations due to WPB by about 10 m. Therefore, it is important to consider all factors together. The geoid changes mainly result from changes of the dynamic topography, which are about −300 to +500 m. The obtained results show that including WPB may significantly improve the reliability of instantaneous global dynamic models.
References
Kaban, M. K., Petrunin, A. G., Schmeling, H., & Shahraki, M. (2014). Effect of decoupling of lithospheric plates on the observed geoid. Surveys in Geophysics, 35(6), 1361-1373.
Kreemer, C., Holt, W. E., & Haines, A. J. (2003). An integrated global model of present-day plate motions and plate boundary deformation. Geophysical Journal International, 154(1), 8-34.
Zhang, S., & Christensen, U. (1993). Some effects of lateral viscosity variations on geoid and surface velocities induced by density anomalies in the mantle. Geophysical Journal International, 114(3), 531-547.
Kontakt
