Resynthesized Variability of AOD1B Products
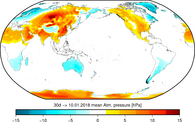
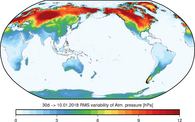
Atmospheric Surface Pressure
Figure: Meanfield (left) and variability (right) of atmospheric pressure as averaged over the last 30 days relative to the meanfield for the period 2003-2014.
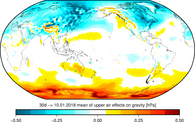
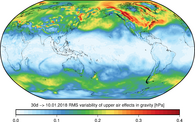
Upper-Air Density Anomalies
Figure: Meanfield (left) and variability (right) of upper-air density anomalies averaged over the last 30 days relative to the meanfield for the period 2003-2014.
Ocean Bottom Pressure
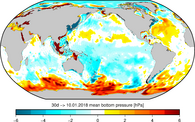
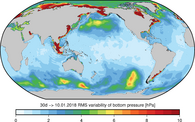
Figure: Meanfield (left) and variability (right) of ocean bottom pressure averaged over the last 30 days relative to the meanfield for the period 2003-2014.
Reference Paper
Dobslaw, H., Bergmann-Wolf, I., Dill, R., Poropat, L., Thomas, M., Dahle, C., Esselborn, S., König, R., Flechtner, F.: A New High-Resolution Model of Non-Tidal Atmosphere and Ocean Mass Variability for De-Aliasing of Satellite Gravity Observations: AOD1B RL06. Geophysical Journal International, in preparation.