Head: Dr. Tilo Schöne
With the devastating tsunami in Indonesia in 2004, or later in 2010 with severe earthquakes in Haiti and Chile insufficiencies in global geodetic Earth observation and hazard monitoring and the need for improved impact prediction and early warning were clearly demonstrated. Section 1.2 contributes with it’s expertise in sea level and GNSS measurements to the tsunami warning system in Indonesia, in Oman, and more generally, to systems around the Indian Ocean.
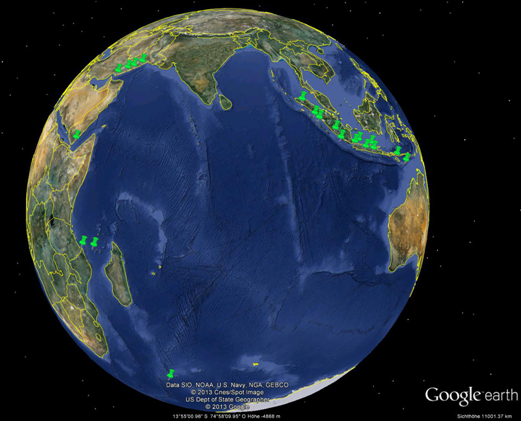
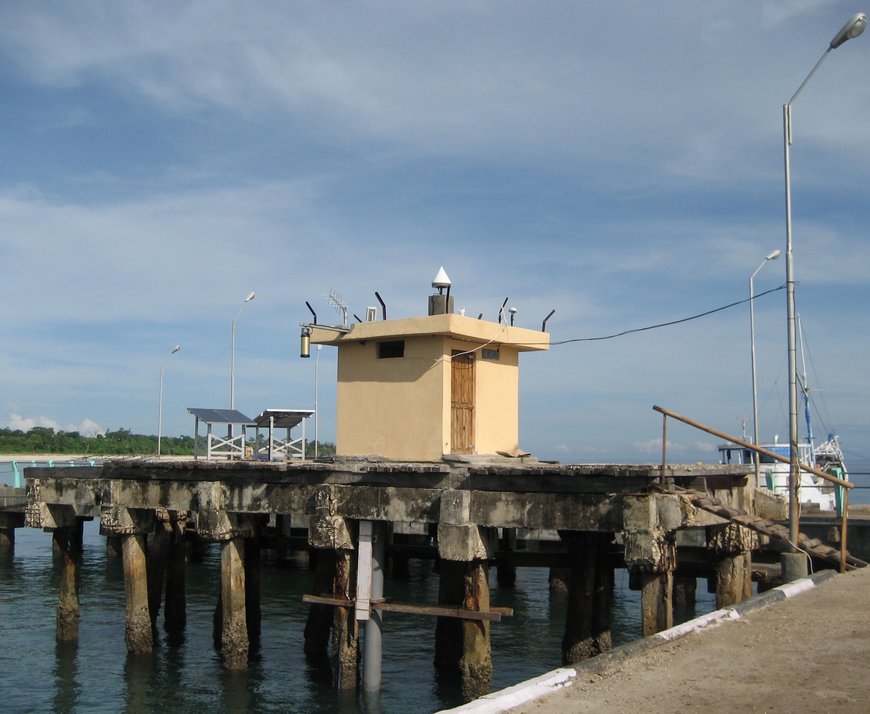
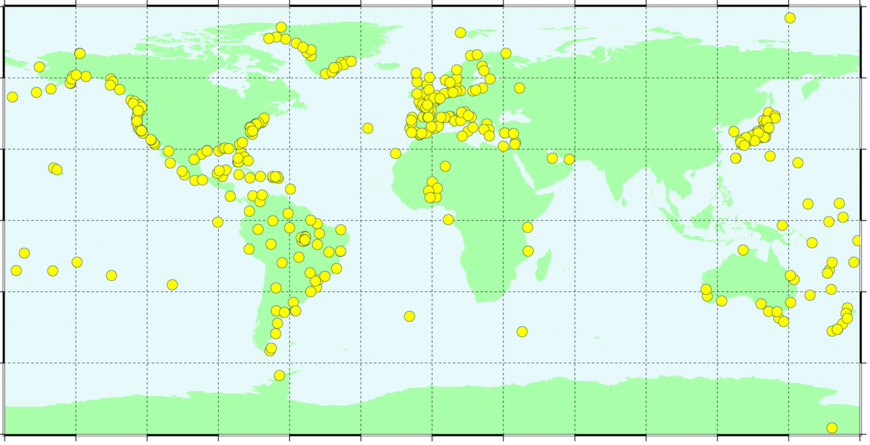
Section 1.2 operates a large network of tide gauges around the Indian Ocean. Most stations are GNSS-controlled gauges. This network contributes to various Indian Ocean Tsunami Early Warning Systems (e.g., the Indonesian InaTEWS) and is part of our sea level monitoring system. Beside the early warning aspect, the gauges are used as ground control for satellite radar altimetry and contribute to the IGS TIGA Project. At each gauge a suite of individual tide gauge sensors is sampling and analyzing the water level for tsunamis and provides this information to international users. The connected GNSS ensures the monitoring of long-term or rapid height changes, providing a reliable height control. In addition, all data is used for our climate monitoring activities as well.
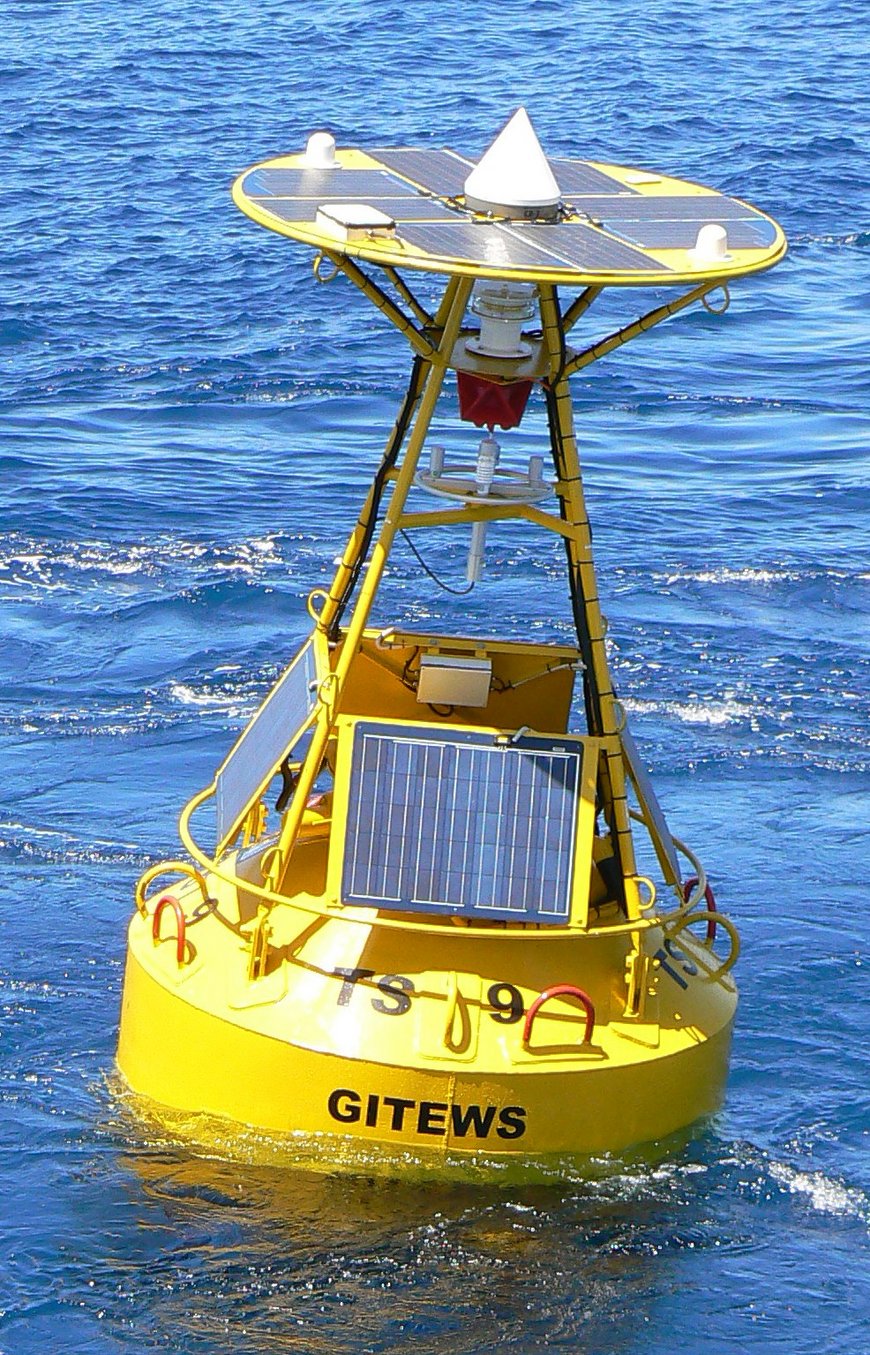
Based on early experience in the development of GPS-equipped near-shore buoys for radar altimetry calibration and river buoys for flood monitoring, this technology has meanwhile been extended to sense the sea surface heights with high-precision differential GNSS for sites of up to 80nm off-shore. With today’s processing capabilities, this technology is able to detect tsunami waves down to 5cm amplitude, which is sufficient for the large tsunamis expected off Sumatra. The ruggedized buoys/typo3/ had been operated as part of the Indonesian Tsunami Early Warning System (InaTEWS) in water depths up to 6000m.
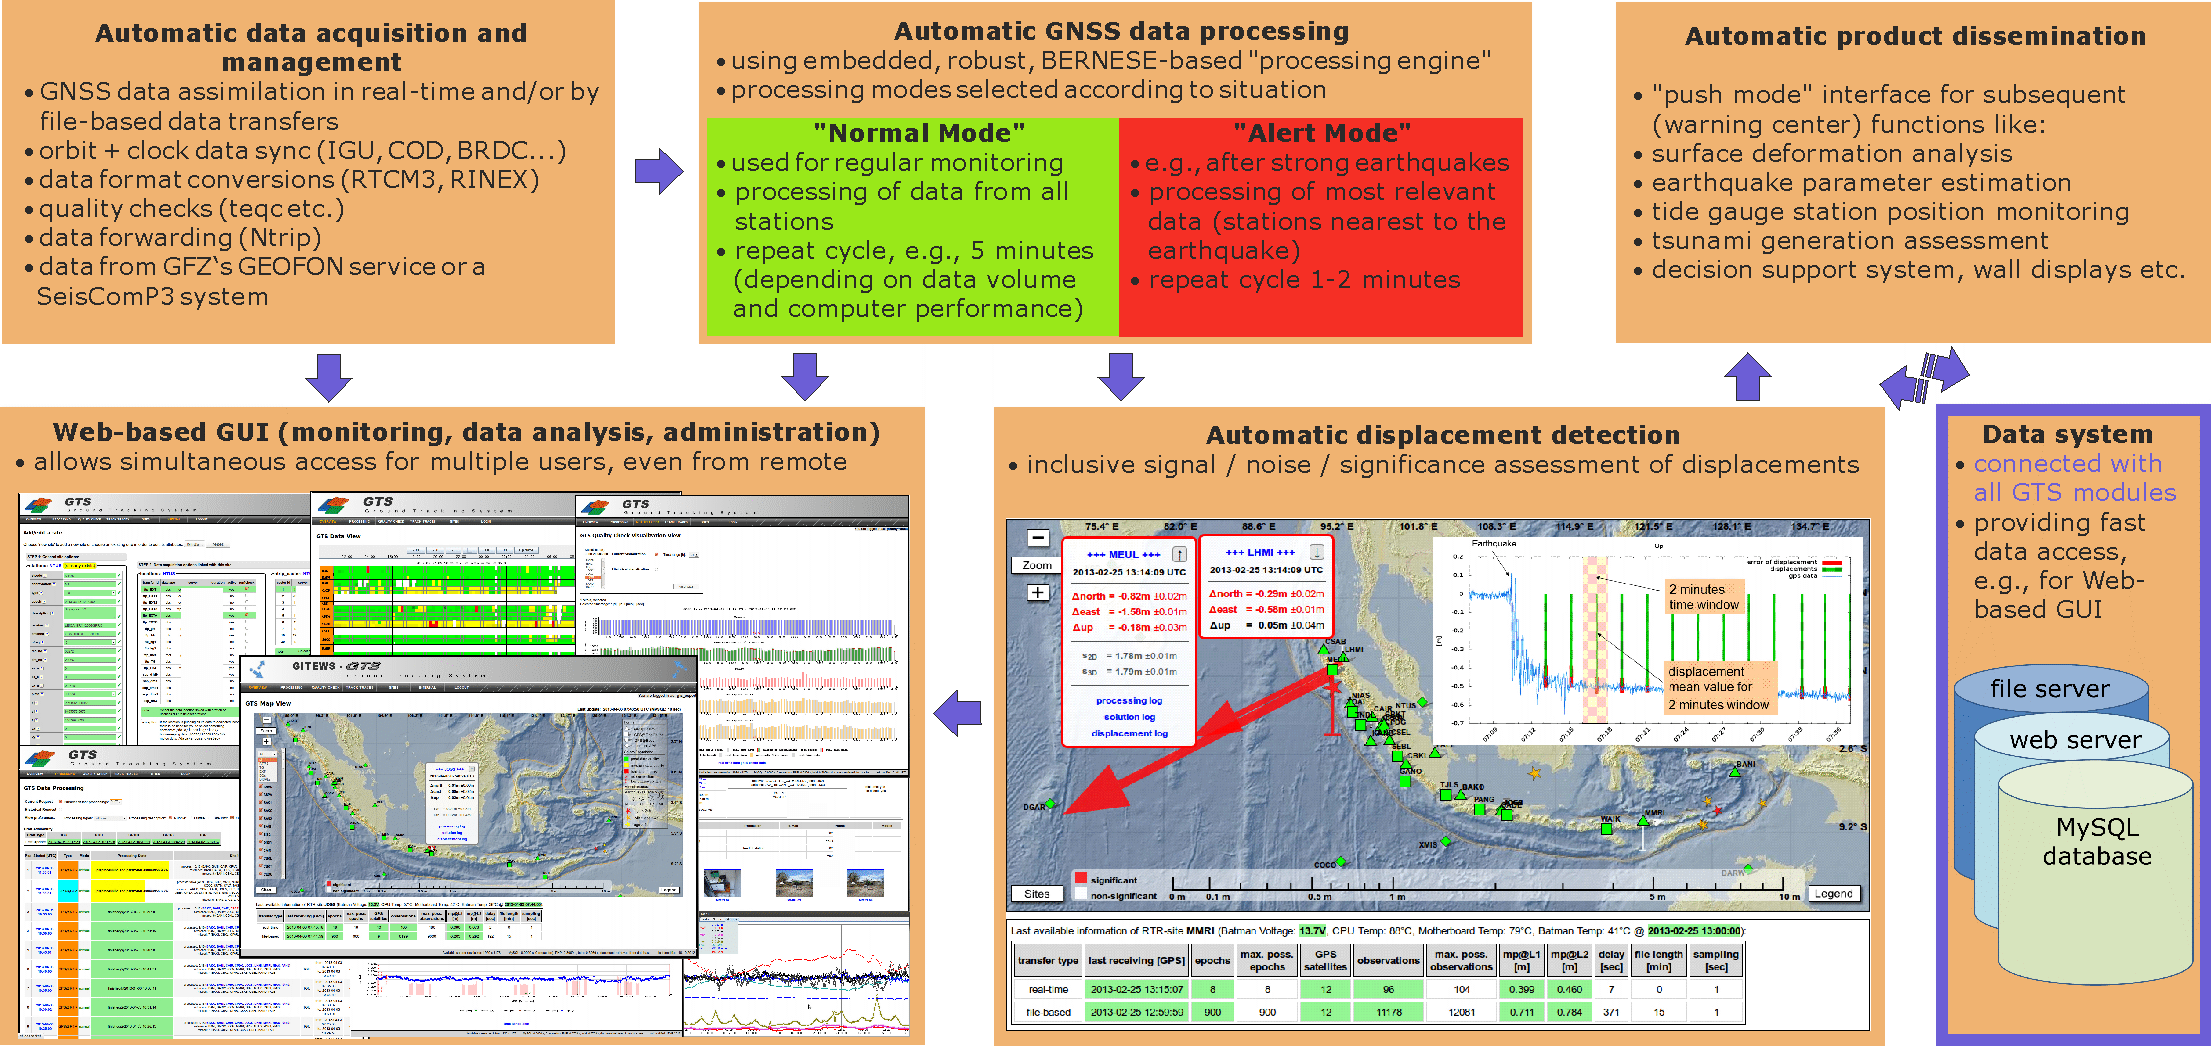
A third component is the GNSS displacement detection system/typo3/ (Ground Tracking System). This software system operated as part of InaTEWS detects and estimates earthquake-related ground movements using GNSS data from various locations over wider areas. Data input is obtained either real-time or on request from GNSS stations (GPS Real-Time Reference Stations , remotely operated multi-parameter stations (ROMPS)). The individual station coordinates (North, East, Up) are precisely and continuously estimated with low latencies (e.g., less than 5 minutes), using a network of reference stations and an automatic near real-time data processing system. Information on co-seismic displacements provides important information to recognize the mechanism of an earthquake and thus of the earthquake’s potential to generate a tsunami.
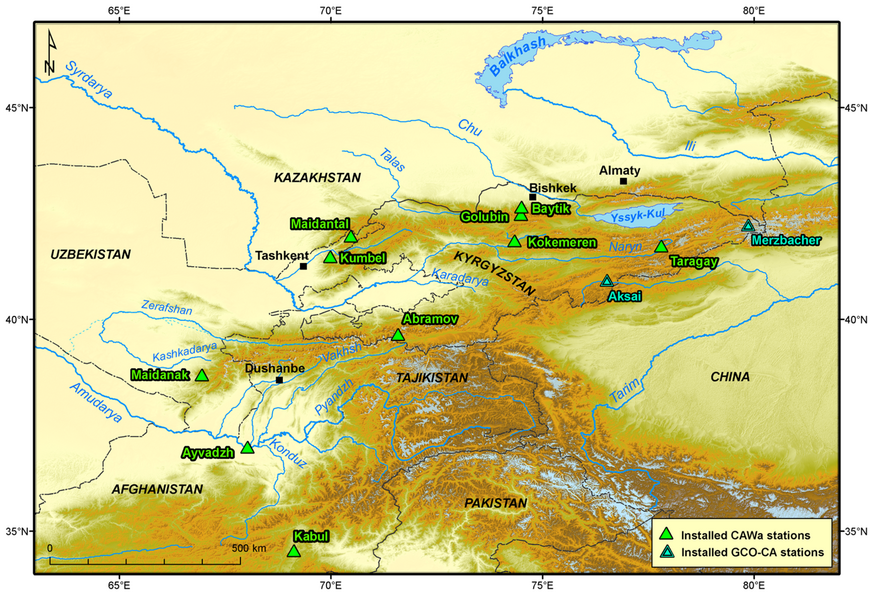
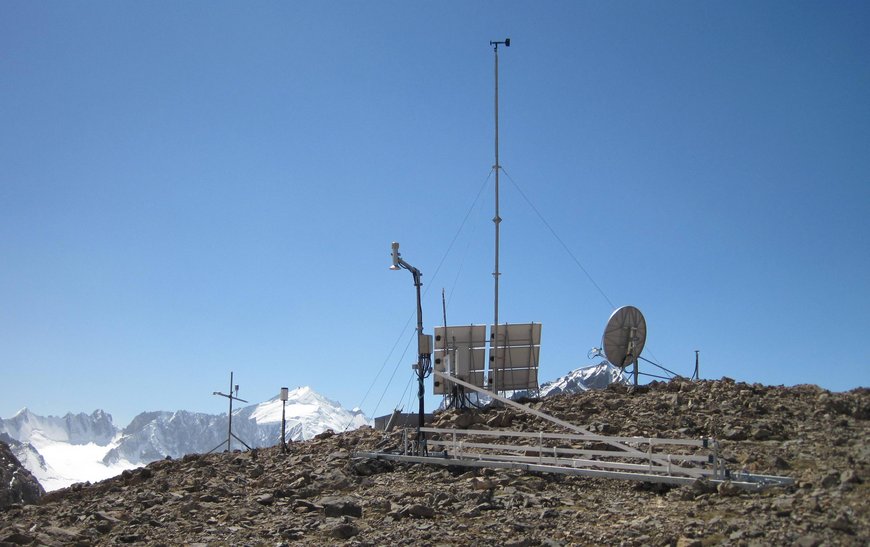
Also an important research field is the contribution of Section 1.2 for the establishment and operation of a hydrometeorological network in Central Asia (CAWA) and the contribution to GFZ’s Global Change Observatory at Glaciers in Central Asia (GCO-CA). Based on the long-term experience of our Section in designing and operating remotely operated multi-parameter stations (ROMPS), we provide technological and scientific expertise to Central Asia. Since many years Central Asia is suffering from the short-falling of fresh water for living and irrigation. In 2008 the Berlin Process of the German Foreign Ministry addressed this issue asking for the establishment of a hydrological monitoring system in this region. Our monitoring system is providing the necessary ground-based data (GNSS, meteorological parameters, snow parameters, discharge data), which are either used in climate models and are used to validate time variable gravity fields (hydrological cycle) and radar altimetry of CryoSat-2 (Glacier mass and volume balances).
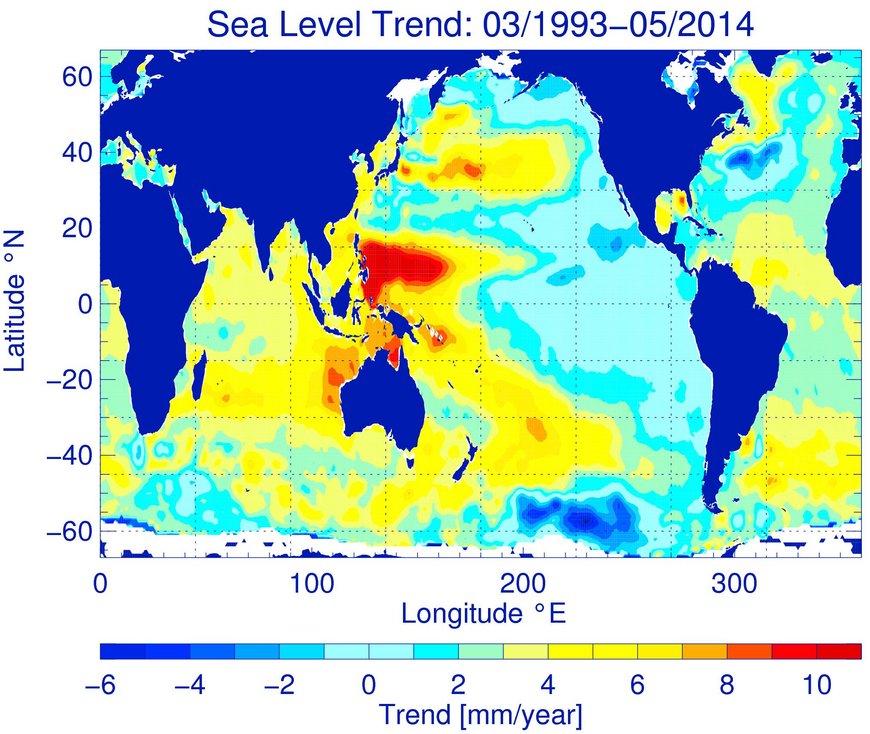
Sea Level rise is of great concern, both on the global as well as on regional scales. While the global average rise (within the ±66° latitude band) is around 3mm/year, local rates can be much higher due to, e.g., human-induced land subsidence (coastal compaction, oil and natural gas extraction, fresh water supply). We continuously analyze and improve data from past and current radar altimetry missions to estimate sea level parameters, like global sea level change, global sea level budget, basin scale sea level variability in the North Atlantic, and provide validation of GRACE ocean dealiasing products. Our goal is to close the sea level budget, the combination of three observation types (1) the geometric observation of sea level with radar altimetry (ocean volume), (2) the GRACE-based observed changes of the oceans mass, and (3) the observed steric expansion of the ocean water. The focus of our Section is in the harmonization and inter-calibration of radar altimetry missions and orbit determination/typo3/ based on most recent gravity field models. This work is supported by our contribution to TIGA and by the operation of GNSS-controlled tide gauges around the Indian Ocean.
As part of our regional sea level hazard monitoring program we are operating two GNSS-controlled tide gauges in Indonesia (Semarang, Jakarta). Semarang is experiencing subsidence of up to 10cm/year caused by soil compaction and fresh water extraction. Jakarta is subsiding at a slightly lower rate. However, large parts of Jakarta are below mean sea level. Frequent torrential rain causes flooding of those areas, impacting the infrastructure and causing health problems. For this research field we are contributing to GGOS Theme 3.
The most important projects of Topic 4 are:
- Basin scale sea level variability in the North Atlantic (REKLIM)
- Automatic near real-time processing of GNSS-data for Tsunami Early Warning Systems
- GNSS-controlled Tide Gauges/typo3/ and GNSS analyses at tide gauges (IGS-TIGA)/typo3/
- Operation of a Hydrometeorological Network in Central Asia.
Our geodetic monitoring infrastructure contributes to IAG and GGOS activities and provides the basis to assess long-term, short-term and rapid changes of various Earth Parameters.
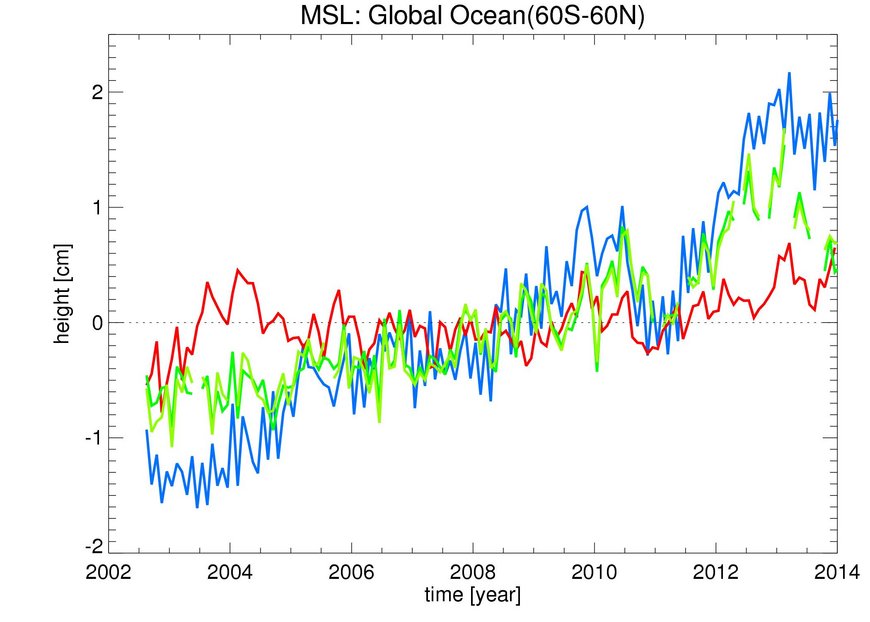
Sea Level Budget
Sea level changes are a key indicator for climate change and per se an important monitoring quantity. We aim at quantifying spatial and temporal scales of sea level variability. In order to gain a better understanding the driving mechanisms of sea level changes are studied. Sea level is governed by changes in oceanic heat content and in mass redistribution in the System Earth, where changes in mass originate from the combined effects of ocean dynamics and freshwater in- and export.
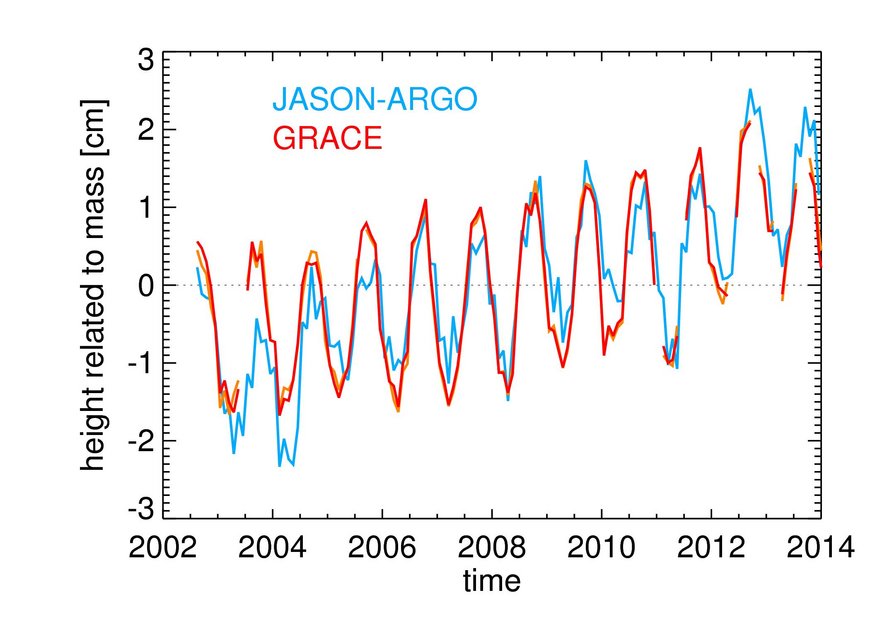
Sea level has been monitored globally by satellite altimeters since the mid 1980's. By means of the progress of the art, the continuous correction of previous measurement data and the harmonization of altimeter data from different missions the estimation of sea level trends has been improved and consolidated. In contrast it has not been feasible to measure the steric and mass components on large spatial scales until recently. From 2002 onwards monthly oceanic mass changes have been derived from the GRACE satellites. The steric component can be inferred from temperature and salinity profiles measured in-situ by the Argo drifter array.
We study total, steric and mass components of the monthly sea level variability starting from end of 2002 using Jason-1 and Jason-2 altimeter data processed by the ADS system, GRACE derived equivalent water level (GFZ-RL05, CSR-RL05) and gridded Argo data from Met Office Hadley Centre for Climate Change. The consistency of the different means of measurements is investigated on global scales, basin-scale mass changes have been studied in the North Atlantic in more detail.
Global mean sea level (total, steric and mass)
Harmonized Altimetry
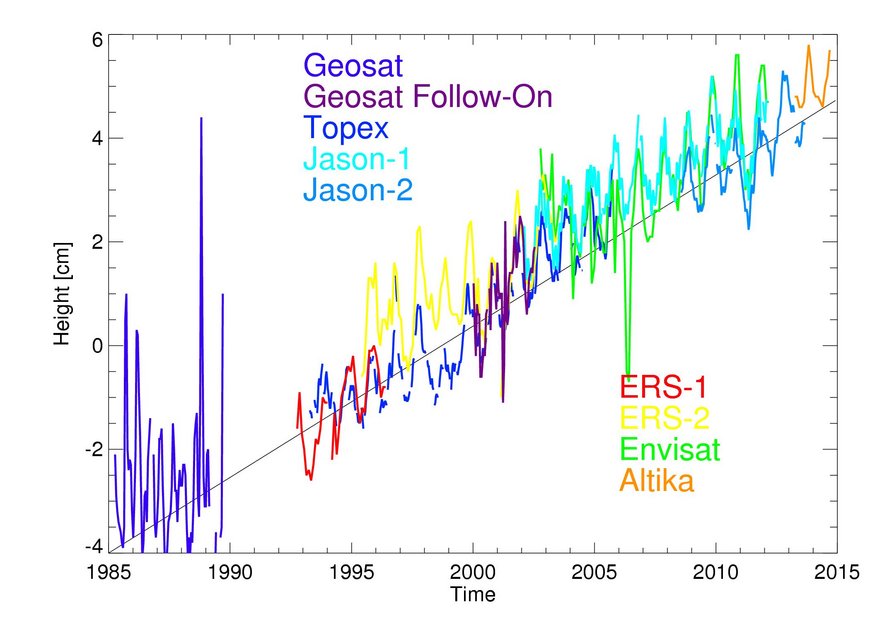
Since the middle of the eighties 11 satellite radar altimeter missions have been launched. Most of these missions have different data formats and processing standards. Since then the correction models applied to the measured ranges have further evolved constantly. As long as single mission studies are performed, these differences can be neglected. However, when comparing or combining different radar altimeter data for e.g. geodetic or climate studies, a harmonization is necessary. In addition, for several studies (e.g. close to the coast) it is necessary to select a set of correction models best fitting the particular application.
In order to integrate, process, update, and harmonize data from different radar altimeter missions the Altimeter Database and Processing System (ADS) has been developed at GFZ. Currently it holds sea surface heigths, winds and wave heights from the following missions for the denoted periods of time:
| Geos-3 | 04/1975 to 11/1978 |
| Geosat | 03/1985 to 10/1989 |
| ERS-1 | 08/1991 to 06/1996 |
| Topex/Poseidon | 09/1992 to 10/2005 |
| ERS-2 | 05/1995 to 06/2011 (North Atlantic only since 05/2003) |
| GFO-1 | 01/2000 to 09/2008 |
| Jason-1 | 01/2002 to 06/2013 |
| Envisat | 10/2002 to 04/2012 |
| ICESat | 02/2003 to 10/2009 |
| Jason-2 | 07/2008 to ongoing |
| Cryosat-2 | 01/2010 to ongoing |
| HY-2A | 10/2011 to ongoing |
| Saral/Altika | 03/2013 to ongoing |
While the data originates mainly from oceanic areas there is also data from inland waters available.
In addition to the radar altimeter data the ADS holds state of the art instrumental, orbital, and environmental correction models.
The structure of ADS allows for integrating upcoming data corrections and new correction models in a timely manner. The parallel storage of different correction models for the most disturbing effects allows for testing their influence on derived quantities, such as mean sea levels and crossover statistics.
In order to produce long and consistent time series the altimeter group at GFZ has been working on the harmonization of the correction models of different missions. Wherever possible the same correction models were provided consistently for all missions. This includes corrections for all tidal effects, dry troposphere and inverse barometer. Other correction models, like the ionospheric or wet tropospheric correction, rely on the satellite hardware. In this case the most accurate correction available is used for each mission. Systematic differences between the different correction models were investigated. Other correction models including, e.g. sea state bias and orbits, are mission dependent and have been recalculated in a consistent manner.
For the inter-calibration of data from different missions two different approaches are taken. Global biases are calculated by multi-mission cross-over point analysis. The other approach is to reference the time series to temporal mean values common for two (or more) altimeter missions.
The ADSC web interface allows external users to retrieve and process data and to derive many statistical quantities.
Global Mean Sea Level
Sea Level Trend (1993 to 2014)
Large scale uncertainties in sea level related to the estimation of the orbit model
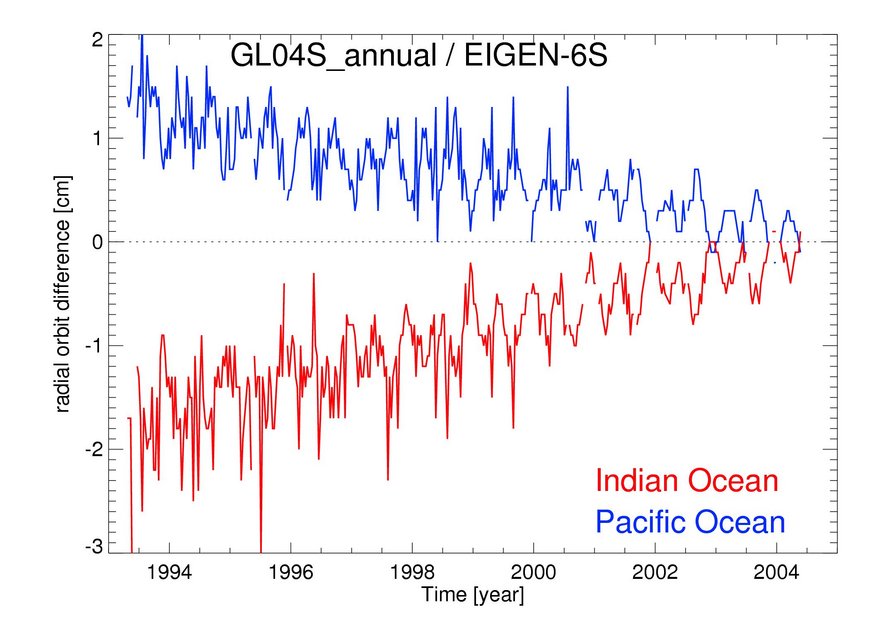
As part of the ESA-CCI sea level new orbit models for ERS-1, ERS-2, Topex, Envisat, Jason-1 and Jason-2 have been estimated at GFZ. This study aims at quantifying the error of local sea level variability and trends related to the actual choice of the orbit solution. We have calculated gridded radial orbit differences from several state-of-the-art orbit models for every cycle of Envisat, Jason-1, ERS-2, and Topex, respectively. The orbit models are originating from the original geophysical data records (GDRs) and from different centers (eg. GFZ, ESOC, GSFC) and are integrated in GFZ's ADS Central system.
Main focus has been on the impact of time variable gravity field models on the orbit estimation. The variability of the radial orbit differences is large scale and seems to be connected to relative shifts of the geocenters of the orbit models. It can be described as the sum of a long term trend (up to 2.5 mm/year) and variability with peaks at frequencies of 180 and 365 days which reach ~10% of the value of the annual sea level signal. Even though the absolute numbers are small they add to the error level of local sea level trend estimations. Further studies on the impacts of additional models (e.g. troposperic models) are under way.
Rudenko, S., Dettmering, D., Esselborn, S., Schöne, T., Förste, C., Lemoine, J.-M., Ablain, M., Alexandre, D., Neumayer, K.-H. (2014): Influence of time variable geopotential models on precise orbits of altimetry satellites, global and regional mean sea level trends. Advances in Space Research 54:92–118, doi:10.1016/j.asr.2014.03.010
Esselborn, S., Schöne, T., Rudenko, S. (2015 online): Impact of Time Variable Gravity on Annual Sea Level Variability from Altimetry. Proceedings of the IAG Symposium 2013, September 1-6, 2013, Potsdam, Germany, Vol. 143, Springer International Publishing Switzerland 2015. Available from: doi:10.1007/1345_2015_103
Rudenko, S., Dettmering, D., Esselborn, S., Fagiolini, E., Schöne, T. (2016): Impact of Atmospheric and Oceanic De-aliasing Level-1B (AOD1B) products on precise orbits of altimetry satellites and altimetry results. Geophys. J. Int., 204(3), 1695–1702, doi:10.1093/gji/ggv545
Topex: sea level differences due to orbit modelling
Basin scale sea level variability in the North Atlantic
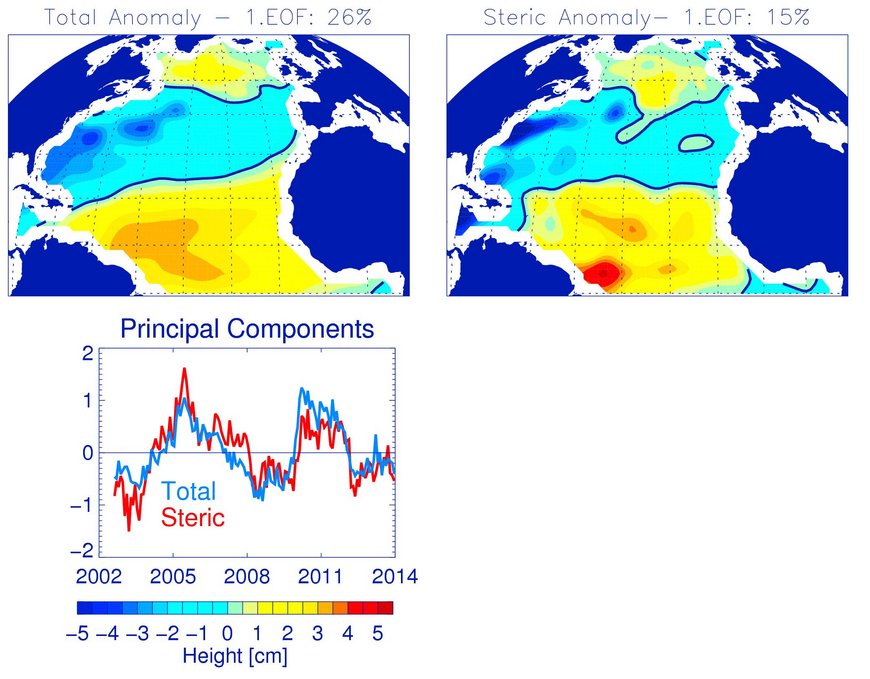
Regional sea level changes and variability of the North Atlantic are studied with focus on its steric and mass related components in the period 2002 to 2015. The data bases are: monthly gridded sea levels from the Jason-1/Jason-2 satellite altimeters processed by the ADS system as well as gridded steric sea levels from Argo floats (MetOffice Hadley Centre for Climate Change) and mass related sea level from the GRACE mission (GFZ RL05a, CSR RL05). The spatial scales investigated are greater than 500 km.
The monthly sea level is in good agreement with the measured steric and mass contributions in the North Atlantic. The Tropical North Atlantic has gained mass since 2009 at a rate equivalent to a sea level rise of ~4 mm/year. The dominant mode of sea level variability is of steric origin and seems to be related to the strength of the subtropical gyre.
Poster at Ocean Surface Topography Science Team Meeting at Konstanz in October 2014.
Main modes of sea level anomaly (total and steric)
Hydrometeorological and Geodetic Network in Central Asia
Introduction
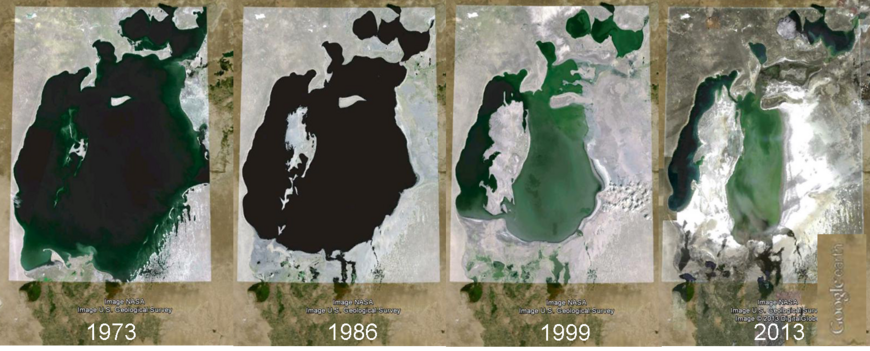
Water is an extremely important resource in Central Asia as the economy is strongly dependent on agricultural production and hydropower. During recent decades, the demand for water has significantly increased due to irrigation development and population growth. While the water of the two largest transboundary rivers are used for generating hydropower in the upstream countries, the downstream countries use huge amounts of the partially polluted water for irrigating agricultural areas. The ineffective use of water and local water policies have increased the shortage of water (since 2010 the Syr Darya river no longer reaches the Aral Sea) and lead to significant political and economical disputes in Central Asia.
The evaluation and estimation of the water balance system and the validation of climate change in this area help to develop strategies for a sustainable water resource management. The determination of meteorological and hydrological data at significant places is the foundation for further water usage policies.
Concept
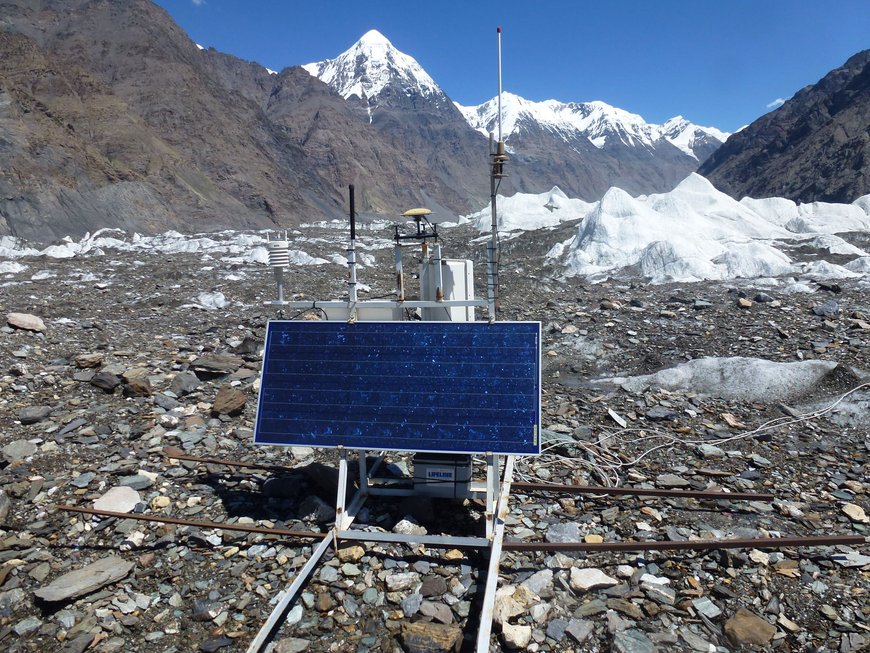
The installation of a modern infrastructure for acquisition and processing of hydrometeorological data is part of the CAWA – project (Central Asian Water). Remotely Operated Multi-Parameter Stations (ROMPS) are installed by GFZ in the Central Asian countries especially in remote areas. Different meteorological, hydrological (snow and discharge parameters) and GNSS data is continuously measured. The data is stored at the station and transmitted regularly to a central Sensor Data Storage System (SDSS) to provide the data to a wide user community.
The Network
The CAWa network consists of currently 12 active stations and further stations are planned. Beside the hydrometeorological sensors and the GNSS receiver, some stations are equipped with broadband seismometers (3), cameras (3), snow pack analyzing systems (4) and discharge monitoring systems (2).
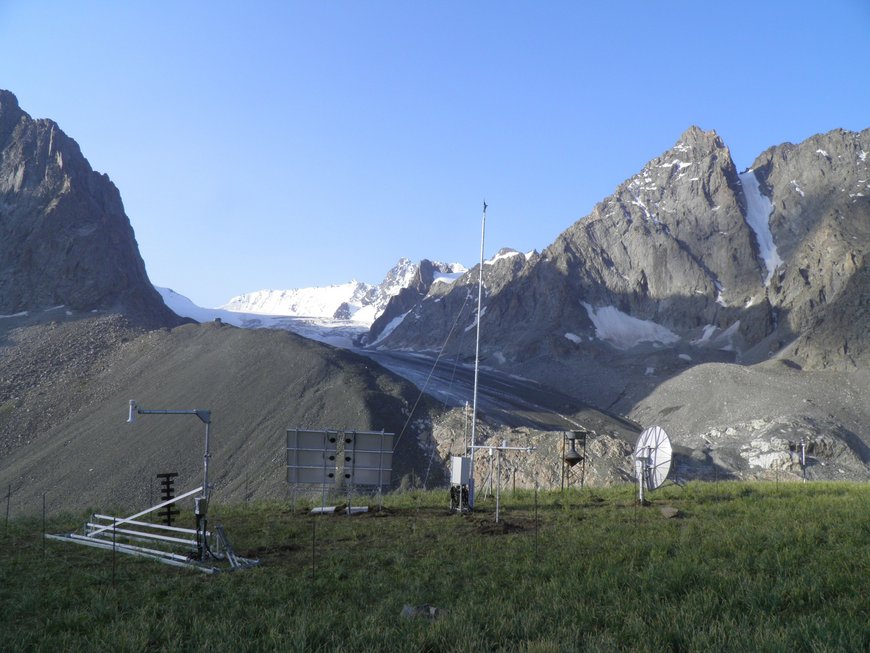
Global Change Observatory Central Asia -Glacier Observatory Inylchek
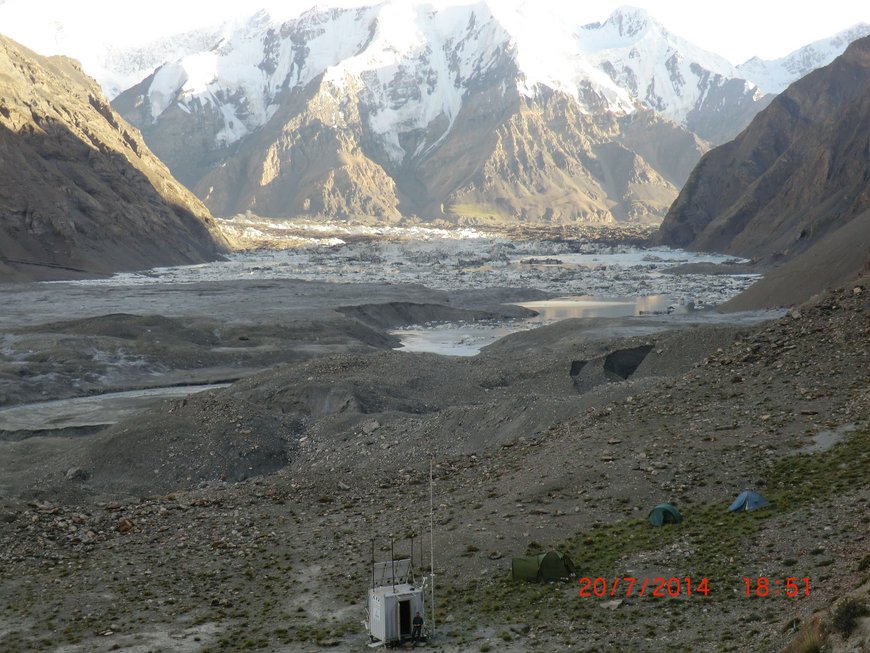
High-mountain glacier areas are of great interest to study climate related changes and fresh water supply especially in Central Asia where water is non-uniformly distributed over the entire region. The Inylchek glacier is one of the largest glaciers of the World and is formed by the northern and southern valley glacier stream. Near the junction point of both tributaries, the pro-glacial ice-dammed Lake Merzbacher is formed by the accumulation of melt-water of the northern Inylchek Glacier and is blocked by the southern stream. During summer time, the lake completely drains within a few days through sub-glacial channels. These glacier lake outburst floods (GLOF) occur regularly at least once a year.
In August 2009, GFZ and the Central Asian Institute of Geosciences (CAIAG, Kyrgyzstan) jointly installed the first GNSS and meteorological station adjacent to the Lake Merzbacher as part of the activities within the Global Change Observatory Central Asia. A year later, the station was replaced with a CAWa ROMPS station. Over the past years, several additional sensors have extended to the local network providing meteorological, hydrological, GPS and seismic data as well as optical cameras that support the monitoring of the GLOF. To directly investigate the behavior of the ice-dam especially during the GLOF, a continuously operating GPS station (ICED) has been installed providing 1Hz GPS data.
Irrespective of the general motion during the year, the ice-dam is strongly influenced by the formation and outburst of the lake. Especially the vertical position and surface velocities increase shortly before the GLOF supporting the assumption that the ice-dam adjacent to the lake became afloat. After the GLOF, the elevation decreases rapidly by 20m in 2014 within eight days. In 2015, the GLOF changes in timing, magnitude and available lake water volume but the behaviour of the ice-dam is similar compared to the year before. These comparable results have the potential to develop an early warning system for the glacier-dammed lake outburst flood.
In addition to the study of the GLOF, the data is used for modeling glacier systems, climate impacts, but also as ground truth for the CryoSat-2 SIRAL altimetry.
GNSS-controlled Tide Gauges for Tsunami Warning and Sea Level research
Detection of tsunamis is requiring near real-time sea level measurements close to their source areas. Here, traditionally, tide gauges are the preferable source for information. Based on our experience in both sea level measurements with tide gauges and GNSS technology, our Section has installed a network of GNSS-controlled tide gauges around the Indian Ocean (GITEWS). In addition, several tide gauges without GNSS have been installed too.
The GNSS-controlled tide gauges are based on our ROMPS concept. Each station has different tide gauge sensors, a GNSS receiver, meteorological devices, and may have a seismometer connected. An embedded computer manages all attached hardware and provides the platform for data acquisition. Up to three different tide gauge sensors are collecting sea level data preferable every 20 seconds. An on-site algorithm is analyzing the incoming data stream for outliers and is estimating the excess between the actual measurement and a predicted tidal value. If the excess exceeds a threshold, the station is transmitting automatically all recently acquired data to a warning center. For tide gauges in Indonesia, a dedicated tsunami warning center (InaTEWS) can activate the station at any time. In addition, all sea level data is transmitted independently and parallel to IOC for international data exchange.
A meteorological compact sensor samples a range of values (e.g., air temperature, air pressure, wind speed, rain, or humidity) every minute. This data is used in short-term for correcting sea level data for inverse barometric effects, which may hamper the detection or falsification of sea level excesses. On the long-term these measurements can be used to study surge effects or long-term trends in sea level.
For the 2004 tsunami in Indonesia large parts of the islands in northern Sumatra have been vertically displaced during the earthquake, leading to a rapid change in the sea level readings. Therefore, all of our tide gauges in Indonesia have been equipped with GNSS to control the vertical as well as horizontal position. The GNSS data can be analyzed in case of a strong earthquake to define, whether a vertical displacement happened as well as for using the displacement to constrain the earthquake source parameters.
These, and the other GNSS-controlled tide gauges, serve additionally to the IGS TIGA Working Group and contribution to international projects and initiatives, like GGOS, GCOS or GLOSS.
For our sea level research, the tide gauge data is used for monitoring the stability of radar altimetry measurements, study local and regional sea level change, and contribute to our sea level hazard monitoring program.
TIGA – Tide Gauge Benchmark Monitoring Project
Tide gauge measurements and satellite radar altimetry are the primary observation methods to study sea level change and sea level variations. Analysis of tide gauge measurements with the purpose of sea level change research requires a well defined vertical reference frame to separate apparent sea level changes from climate induced changes. Such a reference frame can be realized through precise positions of Global Navigation Satellite System (GNSS) stations located at or near tide gauges. Establishing such reference frame is one of the aims of the International GNSS Service Tide Gauge Benchmark Monitoring Pilot Project TIGA. The required accuracies are about 5-10 mm for station positions and less than 1 mm/year for vertical velocities.
GNSS data from more than 600 stations globally distributed are being processed at GFZ TIGA analysis centre using EPOS-Potsdam software (version 8) covering the time span from 1995 till end of 2012 using consistent models. Weekly coordinates of GNSS stations, vertical velocities, and daily values of the Earth Rotation Parameters (x and y pole coordinates and their rates, Length of Day) will be estimated. In addition, precise orbits and clocks are derived from a basic set of globally distributed stations. These data sets will be made public and contributes to the TIGA combination.
The TIGA Analysis Center at GFZ contributes to IGS Data Reprocessing Campaign and to ITRF2013.
Remotely Operated Multi-Parameter Stations (ROMPS)
Global Earth Monitoring in remote areas requires reliable multi-parameter stations to measure local environmental and earth physical parameters. Over the past years, we have developed our ROMPS stations, which are now operated in different environments ranging from -45°C to +50°C temperature, and from the Equator to the high altitudes of the Pamir and Tien Shan, geographically.
A standard set of modules is the basis of each station, in particular a Power Module providing and regulating power lines and a PC Module which contains an embedded Linux-operated PC104. The operation of various communication lines is possible ranging from LAN, GPRS, satellite-phone communication, BGAN or even VSAT to ensure a two-way communication to the data and operation centers. Depending on the application and location, the stations are powered by solar, but can be also operated on mains power, wind or fuel cell power sources.
Different user-defined hardware and data loggers can be integrated and attached to the standard set of modules. A geodetic GNSS receiver is part of our basic set of pre-integrated hardware. The ROMPS are operated as tide gauges using e.g., OTT® data loggers, or as hydrometeorological stations using Campbel Scientific ® data recorders. In special installations, the operation of other hardware components like seismometers (using SeisComp3-Software), or surveillance cameras for glacier monitoring is also possible. Additional hardware can be integrated easily.
All hardware is powered trough a battery manager allowing individual controlled power on/off cycles. The power status as well as internal temperatures are monitored and provided as housekeeping data, allowing an effective station management. The station is operated by this management software that ensures the operation of the station (failover, disk and power status, data transmission, selftest, etc.) without human interaction. Individual sensor software components can be integrated easily.
Additionally, the stations have real-time monitoring capabilities (e.g. GNSS, Seismic) and can be operated as part of Early Warning Systems (e.g., in Indonesia, Oman).
GNSS-controlled buoys
Detection of tsunamis benefits from near real-time off-shore sea level measurements near source areas. Based on our experience in GNSS operated at buoys for radar altimetry calibration, this technology has been further developed and adapted for the Indonesian Tsunami Warning System GITEWS. Under this project, a number of buoys had been build, delivered and operated in Indonesia offshore Sumatra and Java.
The 7 m high buoys with a 2m diameter had been anchored 80 nm to 150 nm offshore the coasts of Sumatra and Java in water depth of up to 6000 m. Each buoy is equipped with a high-precision GPS (Septentrio AsteRX), a motion sensor to account for tilting and three dipping sensors for heave compensation. In addition a wide range of meteorological sensors are measuring supplementary scientific data. The solar powered buoy is designed to withstand the harsh offshore environment and can be moored in water depth down to 6000 m (depth rating of the anchor releaser). Inside the buoy an embedded PC104 works for system management and data storage. All attached sensors are operated and maintained using specially designed software modules. Data is stored on-board for delayed transmission.
Data transmission is the most critical part in off-shore installations. Therefore, three different types of communication equipment are used; INMARSAT’s BGAN network, Iridium satellite phones, and INMARSAT’s Asia-based PASTI phone service. This assembly assures 24 h access to the buoy as well as 24 h data transmission availability. The access is designed as a two-way communication. In case of a potential tsunami thread, the buoys can either be self-activating or may be triggered by the tsunami warning system in Jakarta.
Meteorological data (e. g. air temperature, air pressure, wind speed) are measured every minute. GPS data is sampled at 1 Hz, but down-sampled to 1/3 Hz. In case of a tsunami alert, the most recent hour of GPS data plus continuous 2’ updates are transmitted to the Tsunami warning center. The data processing is a kinematic solution using baseline approaches. The resulting time series of buoy coordinates are correction for dipping and tilting, and is smoothed to reduce for the sea state. This time series is than analyzed for tsunami signatures and used in the decision process in the Tsunami Warning Center.
Note: The GITEWS tsunami buoys are not longer in operation as part of the InaTEWS system.
As a further development using GNSS technologies on floating platforms a river buoy has been developed in cooperation with GFZ’s section 5.4/typo3/. The lightweight and easy to handle buoy is moored at Mekong River for stage monitoring. The GNSS data is transferred with local HF communication to a base station with a GNSS reference station. Both GNSS data sets are transferred by local communication and processed in a differential post-processing mode.
High-frequency sea level from altimetry for the validation of GRACE ocean dealiasing products
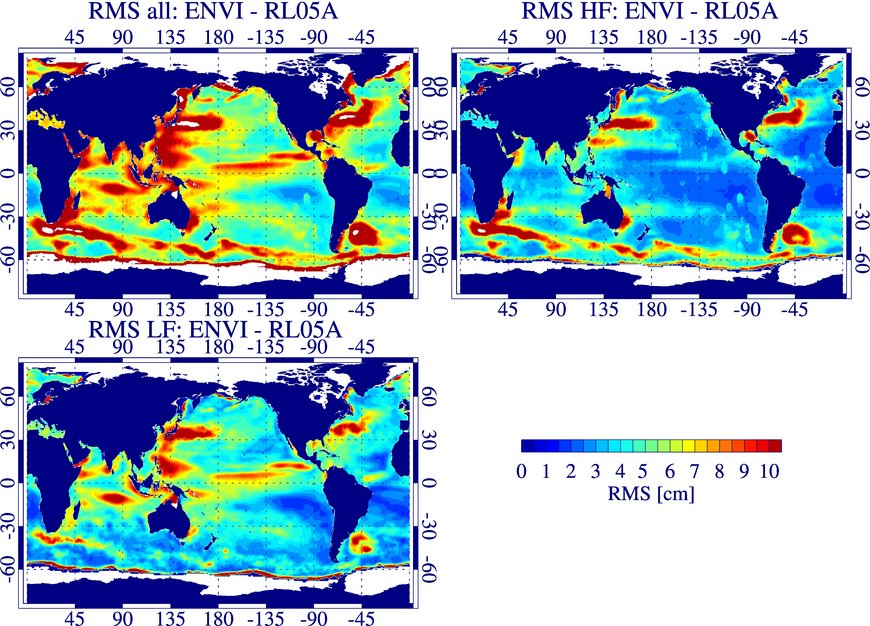
Satellite altimeter data has been commonly used for the validation of ocean circulation models. At GFZ high frequency oceanic mass variations are modeled based on GFZ’s Ocean Model for Circulation and Tides (OMCT) for the dealiasing of GRACE measurements (AOD1B). The new version of the dealiasing product (RL05) has been validated by Jason-1 and ENVISAT altimeter data processed by the ADS system.
The along-track altimeter data for the period 2003 to 2008 is corrected for the effect of sea level pressure variations by a combination of the 6-hourly ocean mass variations estimated by two releases of the OMCT-model (RL04 and RL05) and an inverse barometer effect. This data is co-linearly analysed and mapped on daily 1x1 degree grids afterwards. To extract the high-frequency signals a butterworth-filter with a cut-off period of 30 days has been applied to the daily grids. RL05 oceanic mass data shows improvement relative to the RL04 data for the high-frequency component based on Jason-1 and Envisat data for most open ocean areas. The improvement is especially clear in the Southern Ocean and the Northern North Atlantic.
RMS of sea level from Envisat (2003 to 2008)
Dobslaw, H., Flechtner, F., Bergmann-Wolf, I., Dahle, C., Dill, R., Esselborn, S., Sasgen, I., Thomas, M. (2013): Simulating high-frequency atmosphere-ocean mass variability for dealiasing of satellite gravity observations: AOD1B RL05. J. Geophys. Res. Oceans 118:3704–3711, doi:10.1002/jgrc.20271
Zenner, L., Bergmann-Wolf, I., Dobslaw, H., Gruber, T., Güntner, A., Wattenbach, M., Esselborn, S., Dill, R. (2014): Comparison of Daily GRACE Gravity Field and Numerical Water Storage Models for De-aliasing of Satellite Gravimetry Observations. Surv. Geophys. 1–1, doi: 10.1007/s10712-014-9295-x
Gain in explained variance using OMCT RL05 instead of RL04

![[Translate to English:] Zunahme der erklärten Varianz im hochfrequenten Meeresspiegel (Envisat) bei Verwendung von AOD1B RL05 anstelle von AOD1B RL04 im Zeitraum 01/2003 bis 12/2008](/fileadmin/_processed_/a/a/csm_HF-Sealevel-Bild2_567a16fac5.jpeg)
REKLIM - Reconstruction of Sea Level in the North Sea
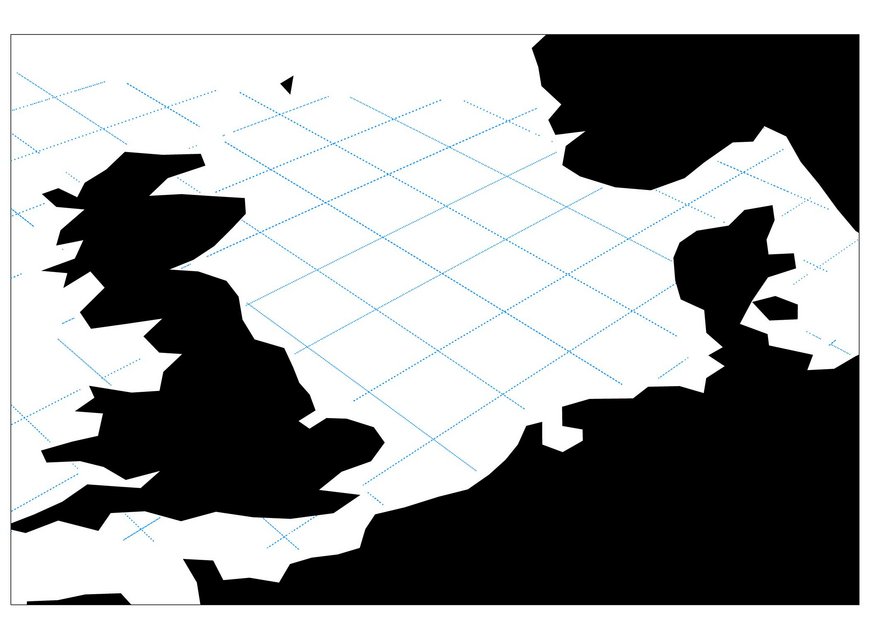
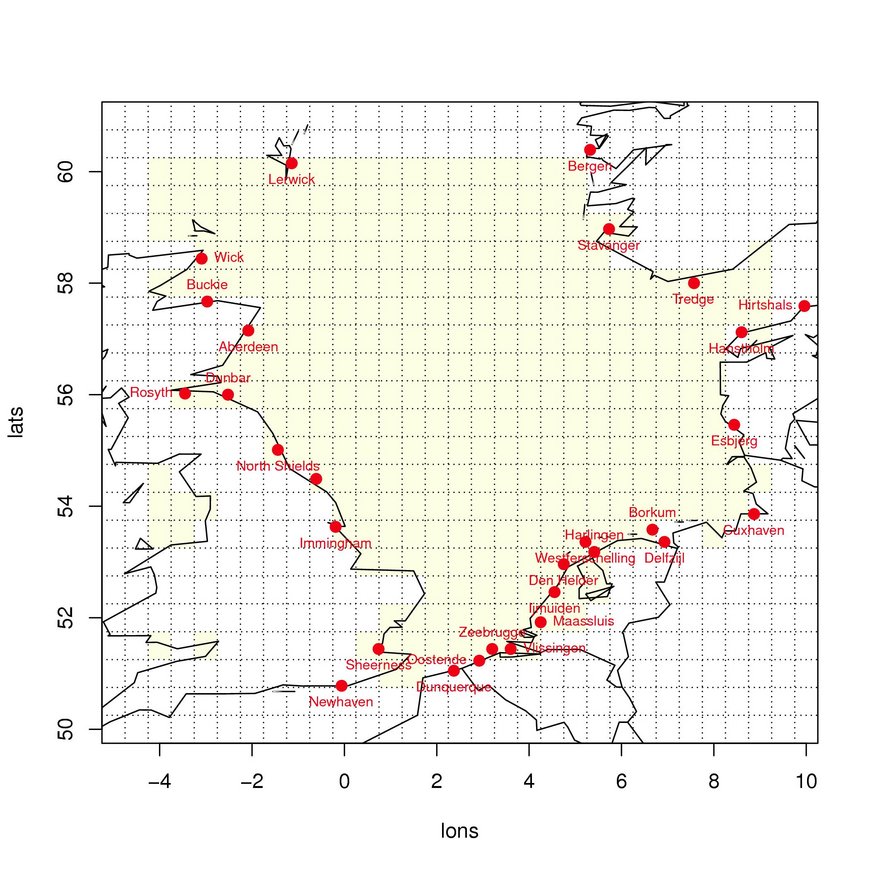
Regional sea level changes are studied as part of Topic 2 'Sea level change and coastal protection' of the REKLIM project of the Helmholtz Association. The coastal area of the North Sea is densely populated and prone to inundation due to storm surges. Sea level trends in the North Sea differ from global ones for the last Decades. In cooperation with the Helmholtz Zentrum Geesthacht and the University of Concepción the yearly mean distribution of sea level in the North Sea is reconstructed from tide gauge and satellite altimeter data starting in 1900. Empirical orthogonal functions (EOF) estimated from Topex, Jason-1 and Jason-2 altimeter data from 1993 to 2012 were combined with historical data from 28 tide gauges from around the North Sea. The altimeter data were processed at GFZ (ADS Central), the tide gauge data originate from PSMSL.
Poster at Ocean Surface Topography Science Team Meeting at Konstanz in October 2014.
Albrecht, F., Esselborn, S.: Regional Sea Level Change in the North Sea since 1900, submitted.
Altimetry
Automatic near real-time processing of GPS-data
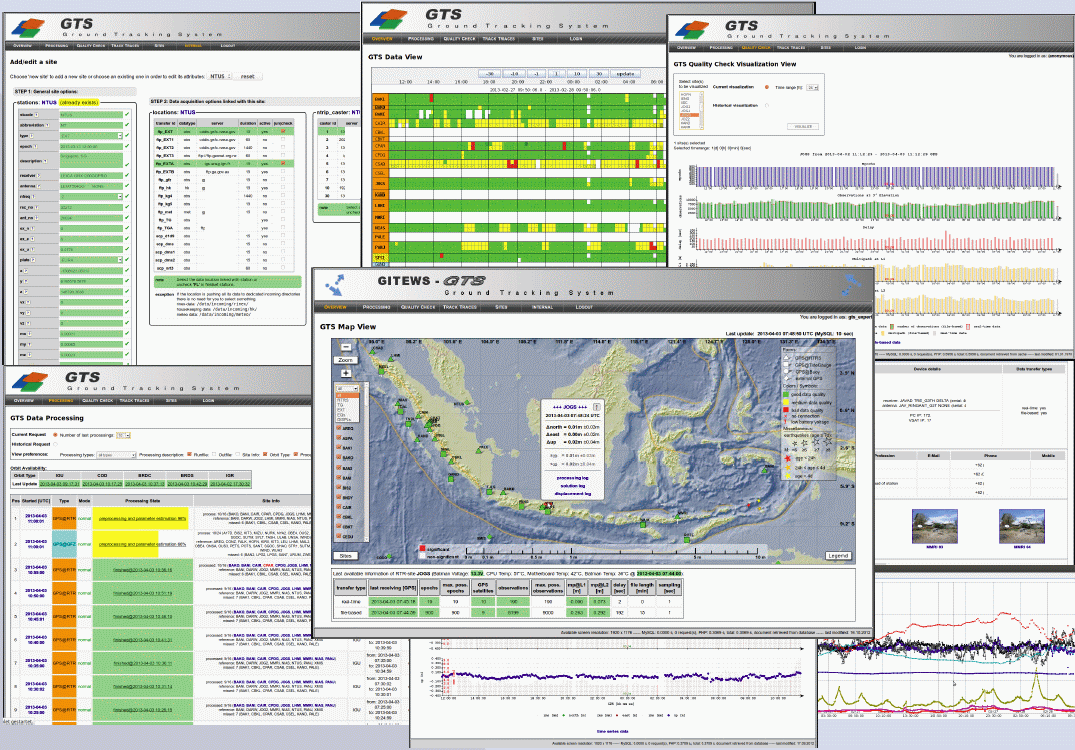
The demand for high accuracy requires the use of high grade, geodetic GPS measurement equipment, but also a careful processing of the GPS raw-data. A fast availability of GPS-based products can only be achieved through an automated data processing system. An automatic system for the processing of GPS-data was developed within the project GITEWS and integrated into the Indonesian tsunami early warning center (INATEWS) in Jakarta (figure 1). This system is in operation since end of 2008.
One component of the new developed system is a web-based, graphical user interface (Web-GUI) that allows an easy to handle monitoring of GPS-networks and the automatic GPS processing system itself. With the help of this Web-GUI the proper function of all system components as well as a possible performance reduction becomes visible for the staff at the early warning center (figure 2) and also from other locations with Internet access at any time.

Reference: Falck, C., Ramatschi, M., Subarya, C., Bartsch, M., Merx, A., Hoeberechts, J., Schmidt, G. (2010): Near real-time GPS applications for tsunami early warning systems. - Natural Hazards and Earth System Sciences (NHESS), 10, 2, p. 181-189.
Automatic near real-time determination of co-seismic displacements (Ground Tracking System, GTS)
The strength (magnitude) and location (epicenter and depth) of a strong earthquake can be determined exactly and fast with the measurement systems and methods of seismology. Seismology also allows an estimation, but until now, not an accurate determination of possible movements (deformations) of the Earth’s surface in the earthquake’s area. To give the important answer to the question, whether a strong earthquake has generated a tsunami or not, the knowledge of these co-seismic deformations is of very high relevance for tsunami early warning. Help comes from GPS-instrumentation (GPS-stations) and a special analysis system which detects and precisely determines ground motions on the Earth’s surface. GPS-based displacement measurements have their strength close to earthquake epicenters, where displacement values are high. Seismological sensors close to an epicenter may have problems (oversteer effects) while measurements from seismological sensors being farer away are delayed according to seismic signal travel times. In combination with other techniques (determination of the mechanism and area that generates a Tsunami) the GPS-based displacement determinations may increase the reliability of tsunami early warnings significantly (figure 1).

A system for an automatic determination of ground motions, respectively co-seismic deformations, was developed by GFZ within the project GITEWS. It is supported by an automatic GPS processing system for near real-time processing of continuously measured data from GPS-stations in Indonesia and surrounding areas. This system has been established at the Indonesian warning center as the so called Ground Tracking System. It can deliver first results (3-d displacement vectors) for relevant locations with GPS-equipment being close to the earthquake within less than 3 minutes, with an update interval of 2 minutes in the further process.
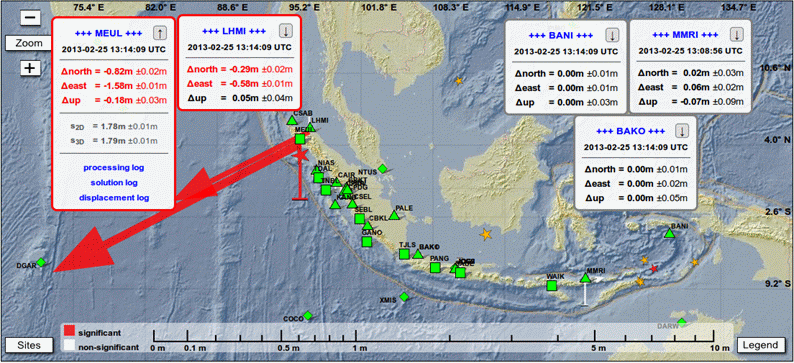
Precise information about possible movements is also delivered for tide gauge locations, if they have appropriate GPS-equipment onsite. If the location of a tide gauge station has moved during an earthquake, then the corresponding sea level data need to be corrected or have to be discarded for early warning applications.
Reference: Falck, C., Merx, A., Ramatschi, M. (2013): Design and benefit of GFZ's GNSS-based Ground Tracking System (GTS) - Poster, The IAG Scientific Assembly 2013, 150th Anniversary of the IAG (Potsdam 2013).
GPS Real-Time Reference Stations
The precision, reliability and fast availability of GPS-data demanded from applications for early warning tasks result in high requirements with respect to the GPS-instrumentation (GPS-stations). GFZ operates a globally distributed network of GFZ-developed GPS-stations for geodetic tasks since many years, which also fulfill the requirements for early warning tasks.
In the framework of the project GITEWS, GFZ installed GPS reference stations in Indonesia, which should be easily serviceable on-site (figure, center). Based on the long term experience with the GFZ-stations in the global network a new station design was developed where components are installed in modules. The modules and connecting cables can easily be checked and replaced at the front-side of the rack. A necessary integration of components from other manufacturers or of different type (e.g., replacements for out of stock components) after some years of operation is well supported by the modular design. The GPS-antennas of the stations are installed on solid concrete fundaments and low heights above the ground (figure, right). This ensures a high stability even in case of earthquakes and a good coupling of the construction to the ground. The stations have two different and thus completely independent satellite communication systems. The GPS-data measured at these stations is transferred to the warning center in Jakarta in real-time. Due to the specifications this station type is called GPS RTR station (Real-Time Reference). The network of GPS real-time reference stations in Indonesia is the backbone of the GPS-based system-components being established in the national early warning system.
Graphical User Interface for GNSS-based monitoring
Graphical user interfaces for GNSS-based technology are the visible parts of programs, allowing users to operate GNSS-devices and GNSS data processing software. A lot of programs are available for GNSS-based applications with many users (e.g., GPS-based mobile navigation), but only a few for special monitoring tasks (e.g., for early warning), for which it can become necessary to develop special software packages.
Special monitoring tasks notably need a tailored display for measured data. For early warning applications it must furthermore be demanded to have a very fast processing of relevant data and parameter, combined with directly and certainly graspable, graphical displays. A graphical user interface which fulfills these high requirements was developed for the monitoring and operation of GPS-stations (e.g., GPS real-time reference stations), the automatic near real-time GPS-processing systems and the Ground Tracking System as used in the project GITEWS. The system has a web-based design, allowing all functions and views to be provided via the Internet. A system-user does not need any special software or a certain computer operating system, a regular web-browser program is sufficient. The system displays all relevant parameter, from the operation status of an individual station or the processing system to the system products, e.g., as co-seismic station displacements, derived from the measurements. Beyond that the system offers comfortable functions for otherwise laborious administrative tasks, like the integration of new GNSS-sensors. If necessary the system design also allows an adaptation to new tasks. Examples are the proven interaction with real-time GNSS-data processing software and an experiment to determine the radiation resistance (for space qualification) of a GNSS-receiver at a Cyclotron radiation source (see picture below).

Literature
Mann, T., Rovere, A., Schöne, T., Klicpera, A., Stocchi, P., Lukmann, M., Westphal, H. (2016): A revision of Holocene sea-level oscillations in the Strait of Makassar. Geomorphology, 257, p. 155-163
Zubovich, A., Schöne, T., Metzger, S., Mosienko, O., Mukhamediev, S., Sharshebaev, A., Zech, C. (2016 online): Tectonic interaction between the Pamir and Tien Shan observed by GPS. Tectonics, 35, p. 283-292
Illigner, J., Sofian, I., Abidin, H., Arief Syafi'i, M., Schöne, T. (2015 online): Coastal Sea Level Monitoring in Indonesia – Connecting the Tide Gauge Zero to Leveling Benchmarks. In: International Association of Geodesy Symposia Series, Berlin, Heidelberg : Springer
Zech, C., Schöne, T., Neelmeijer, J., Zubovich, A., Galas, R. (2015 online): Geodetic Monitoring Networks: GNSS-derived Galcier Surface Velocities at the Global Change Observatory Inylchek (Kyrgyzstan). In: International Association of Geodesy Symposia, Berlin [u.a.] : Springer
Rudenko, S., Dettmering, D., Esselborn, S., Schöne, T., Förste, C., Lemoine, J.-M., Ablain, M., Alexandre, D., Neumayer, K.-H. (2014): Influence of time variable geopotential models on precise orbits of altimetry satellites, global and regional mean sea level trends. Advances in Space Research, 54, 1, p. 92-118
Schöne, T., Zech, C., Unger-Shayesteh, K., Rudenko, V., Thoss, H., Wetzel, H.-U., Gafurov, A., Illigner, J., Zubovich, A. (2013): A new permanent multi-parameter monitoring network in Central Asian high mountains - from measurements to data bases. Geoscientific Instrumentation, Methods and Data Systems, 2, 1, p. 97-111
