

Direct access to data download:
- State-of-the-art data download and figures on the new website https://kp.gfz-potsdam.de/en
- Traditional Kp and ap download via FTP server: ftp://ftp.gfz-potsdam.de/pub/home/obs/kp-ap/
- NEW: convenient ASCII format for Kp, ap, Ap, SN, F10.7 via FTP server: ftp://ftp.gfz-potsdam.de/pub/home/obs/Kp_ap_Ap_SN_F107
- NEW: Kp and ap, Kp, ap, Ap, SN und F10.7(real time)
- NEW: Kp and ap since 1932, Kp, ap, Ap, SN and F10.7 since 1932(daily updates)
- NEW: DOI (old WDC format, no near real-time): https://doi.org/10.5880/Kp.0001
Indices of Global Geomagnetic Activity
The geomagnetic three-hourly Kp index was introduced by J. Bartels in 1949 and is derived from the standardized K index (Ks) of 13 magnetic observatories. It is designed to measure solar particle radiation by its magnetic effects and today it is considered a proxy for the energy input from the solar wind to Earth.
The geomagnetic indices ap, Ap, Cp and C9 and the classification of international Q-days (quiet days in the sense of days with low geomagnetic activity) and D-days (disturbed days in the sense of days with high geomagnetic activity) are derived from the Kp index.
GFZ provides both the definitive index values as well as nowcast versions of the indices. All index data and graphs on this website are subject to the Creative Commons Attribution 4.0 International (CC BY 4.0) license. Please refer to GFZ German Research Centre for Geosciences as data source.
This service contributes to the International Service of Geomagnetic Indices (ISGI) of the IAGA.
News for Kp User:
September 2022: The new Kp websites kp.gfz-potsdam.de/en/ allow state-of-the-art data downloads and contain numerous figures of the Kp index time series and derived products. Also the Hpo index (Hp30, Hp60) is provided from that website. All previous data streams will be maintained.
News for Kp Index Users: DOI and new article on Kp
In March 2021, Kp was assigned a DOI: doi.org/10.5880/Kp.0001 with a dataset publication (Matzka, J., Bronkalla, O., Tornow, K., Elger, K. and Stolle, C., 2021. Geomagnetic Kp index. V. 1.0. GFZ Data Services, doi.org/10.5880/Kp.0001) and a scientific publications (Matzka, J., Stolle, C., Yamazaki, Y., Bronkalla, O. and Morschhauser, A., 2021. The geomagnetic Kp index and derived indices of geomagnetic activity. Space Weather, https://doi.org/10.1029/2020SW002641) for reference.
News for Kp Index Users: filename ambiguity 2020 warning
Since January 2020, the conventional filenames for the Kp index in the WDC format would have become ambiguous on our server ftp://ftp.gfz-potsdam.de/pub/home/obs/kp-ap/wdc/ as Kp2001.wdc could mean a monthly file for January 2020 or a yearly file for the year 2001. Since January 2020, the yearly files are moved to a subdirectory called 'yearly' on the FTP server.
Please find the updated format description here: ftp://ftp.gfz-potsdam.de/pub/home/obs/kp-ap/wdc/wdc_fmt.txt
Despite the fact that each line in these files has its own, correct time stamp, we noticed that some of our users, depending on how they reformat the downloaded data files, have produced corrupted files on their side as a consequence of the filename ambiguity and our mitigation steps.
We recommend our users to check their reformatted files, especially for the early 2000s and the early months of 2020 and especially if they are not sure how their downloading and reformatting algorithm deals with the filename ambiguity.

Most Recent Definitive Indices of the Kp index

Planetary magnetic three-hour-range indices, shown in old style musical diagram:
Definitive Kp Index and derived indices since 1932
As a member of the International Service of Geomagnetic Indices, the GFZ, A.-Schmidt-Observatory Niemegk, supplies historical and current Kp and derived indices per anonymous FTP:
ftp://ftp.gfz-potsdam.de/pub/home/obs/kp-ap/
Note: FTP site may refuse connections due to excessive traffic.
The kp-ap/ directory contains:
- readme.txt: ASCII text file, a plain text copy of the Geomagnetic Indices.
- music.exe: binary executable for Windows PC. music.exe reads Kp/ap values in WDC format and produces a PostScript file with Bartels Kp music diagram. Download music.exe using binary mode! The data file ssc.dat is also required to run music.exe.
- ssc.dat: ASCII data file. List of (storm) sudden commencements (ssc), partly preliminary.
- tab/: Subdirectory. Contains the monthly Kp/ap tables in a simple text format readable for both humans and computers (*.tab). The file tab_fmt.txt provides a format description. The tables distributed by regular mail (PostScript format) are also provided in this directory.
- wdc/: Subdirectory. Contains the monthly (yearly files are found in wdc/yearly/) Kp/ap tables and much more information in condensed tables (ASCII format). The format is nearly identical to the format of Kp/ap tables distributed by the World Data Center A for Solar-Terrestrial Physics. The file wdc_fmt.txt provides a format description. This format does not contain any information on the quiet and most disturbed days as the tables in the tab directory do.
- music/: Subdirectory. Contains the monthly (yearly files are found in music/yearly/) Kp values in the Bartels musical diagram (Postscript format), which is very helpful in visualizing the indices.
- quietdst/: Subdirectory. Contains tables of the quietest and most disturbed days for all months since Jan 1932. (Values since 1900 also supplied, use with caution.)
- kp-freq/: Subdirectory. Contains tables of frequencies of Kp indices.
- ap_monyr.ave: ASCII test file. A table with monthly and yearly averages of Ap.
Download Q, D days
Access via FTP server:
ftp://ftp.gfz-potsdam.de/pub/home/obs/kp-ap/quietdst/
The quiet (Q) and disturbed (D) days:
Geomagnetic disturbances can be monitored by ground-based magnetic observatories recording the three magnetic field components. The global Kp index is obtained as the mean value of the disturbance levels in the two horizontal field components, observed at 13 selected, subauroral stations . The name Kp originates from "planetarische Kennziffer" ( = planetary index).
The following definition of K variations has been given by Siebert (1971):
K variations are all irregular disturbances of the geomagnetic field caused by solar particle radiation within the 3-h interval concerned. All other regular and irregular disturbances are non K variations. Geomagnetic activity is the occurrence of K variations.
Local disturbance levels are determined by measuring the range (difference between the highest and lowest values) during three-hourly time intervals for the most disturbed horizontal magnetic field component. First, however, the quiet-day variation pattern has to be removed from the magnetogram, a somewhat subjective procedure. The range is then converted into a local K index (first introduced 1938 for the magnetic observatory Niemegk near Potsdam) taking the values 0 to 9 according to a quasi-logarithmic scale, which is station specific; this is done in an attempt to normalize the frequency of occurrence of the different sizes of disturbances. But K still remains a local index, describing disturbances in the vicinity of each observatory. According to the geographic and geomagnetic coordinates of the observatories, each observatory still has an annual cycle of daily variations. Using statistical methods, Julius Bartels generated conversion tables to eliminate these effects. By applying the conversion tables, a standardized index Ks for each of the 13 selected observatories is determined. In contrast to the K values, the Ks index is expressed in a scale of thirds (28 values):
0o, 0+, 1-, 1o, 1+, 2-, 2o, 2+, ... , 8o, 8+, 9-, 9o
The main purpose of the standardized index Ks is to provide a basis for the global geomagnetic index Kp which is the average of a number of "Kp stations", originally 11. The Ks data for the two stations Brorfelde and Lovö, as well as for Eyrewell and Canberra, are combined so that their average enters into the final calculation, the divisor thus remaining 11.
Kp was introduced as a magnetic index by Bartels in 1949. Both K and Kp were officially adopted by the International Association for Terrestrial Magnetism and Electricity (IATME, which later became the International Association for Geomagnetism and Aeronomy,IAGA) in 1951 and the series of Kp was extended backwards to 1932 during the subsequent period.
Bartels introduced a musical diagram for a demonstrative presentation of the planetary indices. The musical diagram shows the quantitative values of the Kp. It further enables a quick orientation on the activity by means of the length and the width of the symbols. The repetition of disturbed periods is clearly expressed through the convenient ordering by solar rotations. The musical diagram key is as follows:

During 1949-1996 Kp has been derived at the Institut für Geophysik of Göttingen University, Germany. Since 1997 the Kp and related indices are derived at the Adolf Schmidt Geomagnetic Observatory Niemegk of the Helmholtz Centre Potsdam GFZ German Research Centre for Geosciences. Kp and its related indices (ap, Ap, Cp) are widely used in ionospheric and magnetospheric studies and are generally recognized as indices measuring worldwide geomagnetic activity.
The IAGA-97 Resolutions #5 and #6 recognize the value of preserving the uniqueness of the official IAGA indices and the importance of geomagnetic activity indices for characterization and prediction of a wide range of geomagnetic phenomena.
Geomagnetic ap Index
The three-hour index ap and the daily indices Ap, Cp and C9 are directly related to the Kp index. In order to obtain a linear scale from Kp, J. Bartels gave the following table to derive a three-hour equivalent range, named ap index:

This table is made in such a way that at a station at about dipole latitude 50 degrees, ap may be regarded as the range of the most disturbed of the two horizontal field components, expressed in the unit of 2nT.
Geomagnetic Ap Index
The daily index Ap is obtained by averaging the eight values of ap for each day.
Geomagnetic Cp Index
In order to replace the somewhat subjective index Ci, the Cp index - the planetary daily character figure - was developed. Cp is a qualitative estimate of overall level of magnetic activity for the day determined from the daily sum of eight ap amplitudes. Cp ranges, in steps of one-tenth, from 0 (quiet) to 2.5 (disturbed) and is defined according to the following table:


Classification of Days (deduced from Kp indices)
The selection of the quietest days (Q-days) and most disturbed days (D-days) of each month is deduced from the Kp indices on the basis of three criteria for each day:
- The sum of the eight Kp values.
- The sum of squares of the eight Kp values.
- The maximum of the eight Kp values.
According to each of these criteria, a relative order number is assigned to each day of the month, the three order numbers are averaged and the days with the lowest and the highest mean order numbers are selected as the five (respectively ten) quietest and the five most disturbed days.
Refined Classification
It should be noted that these selection criteria give only a relative indication of the character of the selected days with respect to the other days of the same month. As the general disturbance level may be quite different for different years and also for different months of the same year, the selected quietest days of a month may sometimes be rather disturbed or vice versa.
In order to indicate such a situation, selected days which do not satisfy certain absolute criteria are marked as follows:
- A selected quiet day is considered not really quiet and is marked by the letter A if Ap greater than 6, or marked by the letter K if Ap less or equal 6 and either one Kp value greater than 3 or two Kp values greater than 2+.
- A selected disturbed day is considered not really disturbed and marked by an asterisk (*) if Ap less than 20.
The sites listed here are those used in the creation of the Kp index, and hence also in the derived ap index. The observatories are listed in the order of their geomagnetic latitude (beginning with the highest one).
| # | Code | Name | Land | Aktivität | Lat | Long | K=9 (nT) |
|---|---|---|---|---|---|---|---|
| 1 | LER | Lerwick | Scotland | 1932-heute | 60°08' | 358°49' | 1000 |
| 2 | MEA | Meanook | Canada | 1932-heute | 54°37' | 246°40' | 1500 |
| 3 | SIT | Sitka | Alaska | 1932-heute | 57°03' | 224°40' | 1000 |
| 4 | ESK | Eskdalemuir | Scotland | 1932-heute | 55°19' | 356°48' | 750 |
| 5 | LOV | Lovö | Sweden | 1954-2004 | 59°21' | 17°50' | 600 |
| UPS | Uppsala | Sweden | 2004-heute | 59°54' | 17°21' | 600 | |
| 6 | AGN | Agincourt | Canada | 1932-1969 | 43°47' | 280°44' | 600 |
| OTT | Ottawa | Canada | 1969-heute | 45°24' | 284°27' | 750 | |
| 7 | RSV | Rude Skov | Denmark | 1932-1984 | 55°51' | 12°27' | 600 |
| BFE | Brorfelde | Denmark | 1984-heute | 55°37' | 11°40' | 600 | |
| 8 | ABN | Abinger | England | 1932-1957 | 51°11' | 359°37' | 500 |
| HAD | Hartland | England | 1957-heute | 50°58' | 355°31' | 500 | |
| 9 | WNG | Wingst | Germany | 1938-heute | 53°45' | 9°04' | 500 |
| 10 | WIT | Witteveen | Netherland | 1932-1988 | 52°49' | 6°40' | 500 |
| NGK | Niemegk | Germany | 1988-heute | 52°04' | 12°41' | 500 | |
| 11 | CLH | Cheltenham | USA | 1932-1957 | 38°42' | 283°12' | 500 |
| FRD | Fredericksburg | USA | 1957-heute | 38°12' | 282°38' | 500 | |
| 12 | TOO | Toolangi | Australia | 1972-1981 | -37°32' | 145°28' | 500 |
| CNB | Canberra | Australia | 1981-heute | -35°18' | 149°00' | 450 | |
| 13 | AML | Amberley | New Zealand | 1932-1978 | -43°09' | 172°43' | 500 |
| EYR | Eyrewell | New Zealand | 1978-heute | -43°25' | 172°21' | 500 |
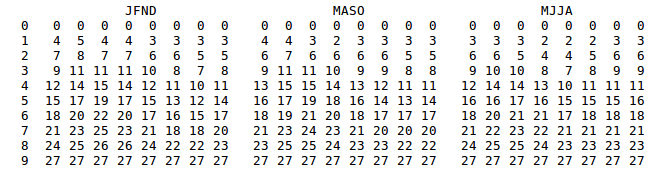
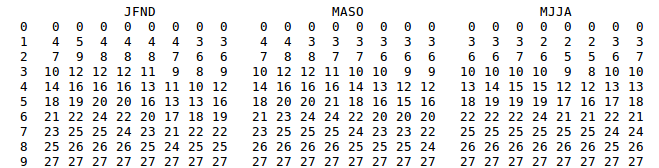
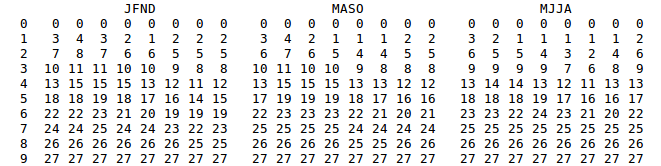
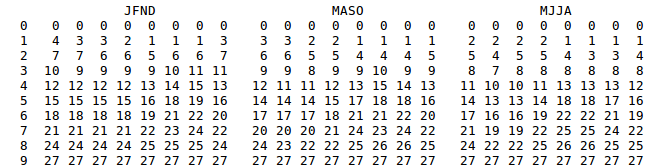
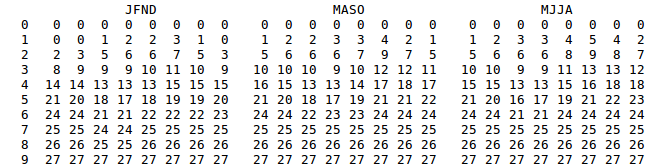
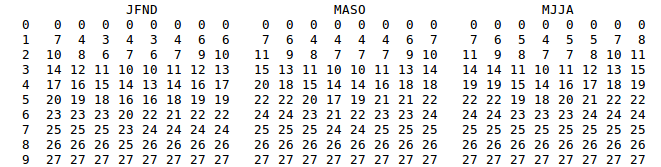
From K to Ks
There is a pronounced diurnal variation in the K index at a single station, with intervals close to local midnight being substantially more disturbed in comparison with those centered on local noon. This diurnal variation also exhibits seasonal and latitudinal dependence. Mere averaging of the logarithm of activity was therefore not considered proper unless the stations were densely and evenly distributed over the world. To overcome this, a standardization procedure was developed by J. Bartels for assigning to each K value a standardized alternate - designated by Ks - which could be more refined than K in the sense that it is given in thirds.
The present conversion tables for three seasons have been prepared using selected data from 1943 to 1948 (except Niemegk). The three seasons are:
- JFND
The months around winter solstice: January, February, November and December.
- MASO
The months around the equinoxes: March, April, September and October.
- MJJA
The months around summer solstice: May, June, July and August.
")
Julius Bartels was born August 17, 1899 in Magdeburg, Germany. He studied mathematics, physics and geography in Berlin and Göttingen. After achieving his PhD in 1923, Bartels worked as a postdoc with A. Schmidt at the Potsdam magnetic observatory. His early works dealt with statistical methods especially in atmospheric, geomagnetic and ionospheric tides.
In 1928, Bartels became professor in Eberswalde; in 1936, he became director of the Potsdam Geophysical Institute and full professor at Berlin university. Between 1931 and 1940, he also worked as a research associate at the Department of Terrestrial Magnetism at the Carnegie Institution (Washington D.C., U.S.A.) for longer periods of time. In 1946, J. Bartels became professor in Göttingen, and, in addition, he was director of the Institute for Physics of the Stratosphere at the Max-Planck-Institut für Aeronomie in Lindau, Germany from 1955 to 1964 (Today: Max Planck Institute for Solar System Research).
In 1940, Bartels and his friend S. Chapman published Geomagnetism, a standard work of geophysics until today. In many of his publications, Bartels developed, used and perfected statistical methods. With these statistical methods, he was able to disprove many widely accepted geophysical models on the one hand and develop some very useful and easy to apply geophysical indices on the other. Among these widely accepted and well known indices is the planetary geomagnetic Kp index.
Eliminating regular variations of the Earth's magnetic field, he showed the impact of the Sun's wave and particle radiation. He recognized that seizing this concept in numbers would form a powerful tool for scientists in the research of solar-terrestrial relations. Bartels knew well that this the Kp tables would only be accepted if they were presented in a clearly arranged and lucid manner. The striking success of the three-hourly geomagnetic Kp indices is also due to their brilliant representation in the Bartels musical diagram (musical scales).
Using only geomagnetic data and statistical methods, Bartels claimed the existence of M-regions on the sun that are responsible for geomagnetic activity. Not before 1973 - with the Skylab mission - was observational data of coronal holes gained. The claimed M-regions were identified as coronal holes, which are the source of the fast solar wind that intensifies geomagnetic activity.
Julius Bartels was one of the initiators of the International Geophysical Year (IGY, 1957). When he died March 6, 1964, he had contributed much to the reputation of geophysics worldwide.
The Solar-Terrestrial Sciences section of the European Geophysical Society (EGS) has established the Julius Bartels Medal in recognition of the scientific achievement of Julius Bartels. It is reserved for outstanding research in solar-terrestrial sciences.
Biographical information extracted from W. Dieminger, Julius Bartels (Nachruf), in Mitteilungen aus der Max-Planck-Gesellschaft 1-2, München 1964, and W. Kertz, Einführung in die Geophysik II, Mannheim 1971.
- J. Bartels, The technique of scaling indices K and Q of geomagnetic activity, Ann. Intern. Geophys. Year 4, 215-226, 1957;
- J. Bartels,The geomagnetic measures for the time-variations of solar corpuscular radiation, described for use in correlation studies in other geophysical fields, Ann. Intern. Geophys. Year 4, 227-236, 1957;
- M. Siebert, Maßzahlen der erdmagnetischen Aktivität, in Handbuch der Physik, vol. 49/3, 206-275, Springer, Berlin Heidelberg, 1971; for the description of several indices (in German);
- M. Siebert and J. Meyer, Geomagnetic Activity Indices, in The Upper Atmosphere (Eds. W. Dieminger et al.), 887-911, Springer, Berlin Heidelberg, 1996; for an updated version of the German reference;
- P.N. Mayaud, Derivation, Meaning and Use of Geomagnetic Indices, Geophysical Monograph 22, Am. Geophys. Union, Washington D.C., 1980; for a complete review of the present IAGA indices;
- G.K. Rangarajan, Indices of magnetic activity, in Geomagnetism, edited by I.A. Jacobs, Academic, San Diego, 1989;
- M. Menvielle and A. Berthelier, The K-derived planetary indices: description and availability, Rev. Geophys. 29, 3, 415-432, 1991.
© Kp index data from this website is distributed under the Creative Commons Attribution 4.0 International (CC BY 4.0)
