


OMCT Simulation for AOD1B RL05

OMCT model configuration
The OMCT configuration used for AOD1B RL05 has been gradually updated from the OMCT model version that has been in use for the generation of AOD1B RL04. The spatial resolution was increased to 1.0° on a regular latitude-longitude grid, with now 20 levels in the vertical. Various parametrizations have been modified to adapt to the increased resolution and to align the simulated bottom pressure variability with various observational data-sets.
The initial state of the model was based on temperature and salinity climatologies obtained from the World Ocean Atlas 2001 (WOA01; Conkright, 2002). The model has been subsequently forced by annually varying climatological fields (winds, pressure, 2m-temperatures and freshwater fluxes) for 10 years, followed by 6-hourly real-time forcing from ERA Interim (Dee et al., 2011) covering the period 1989-2000, and finally operational ECMWF data since January 2001.
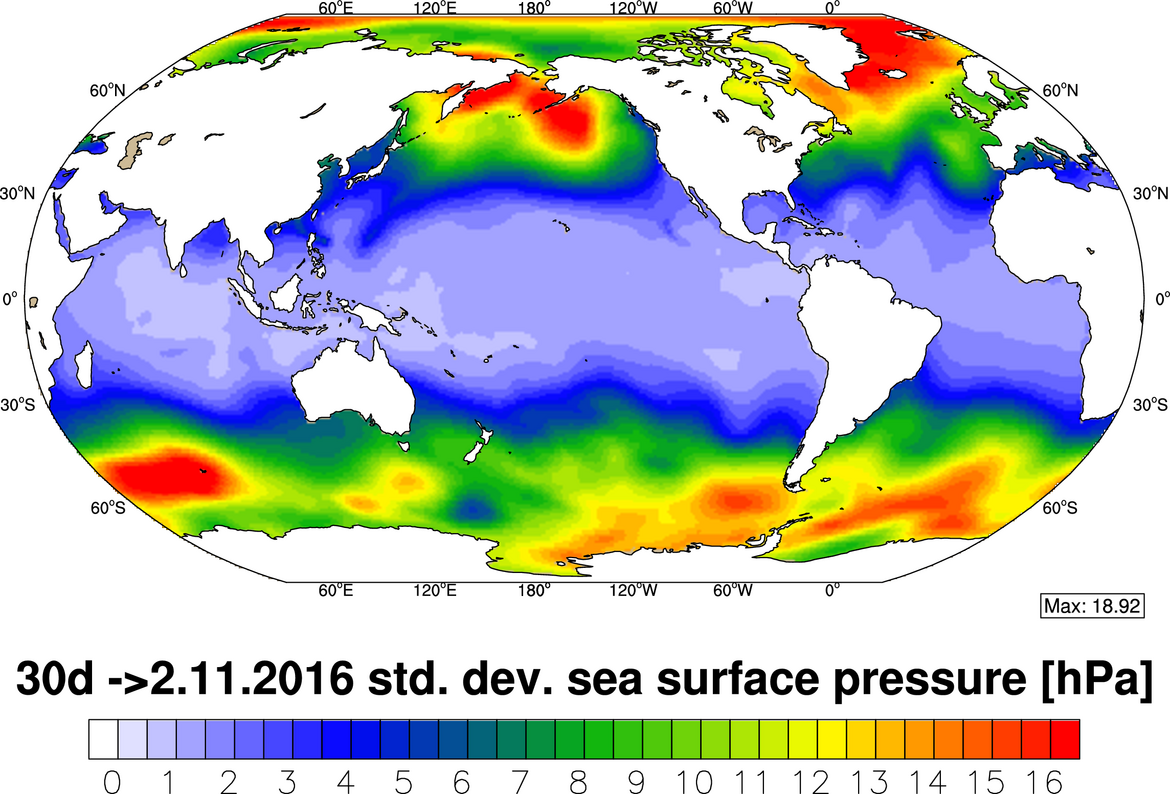
Figure 1: Variability (standard deviation) of ECMWF mean sea-level pressure over 30 days from October/November 2016.
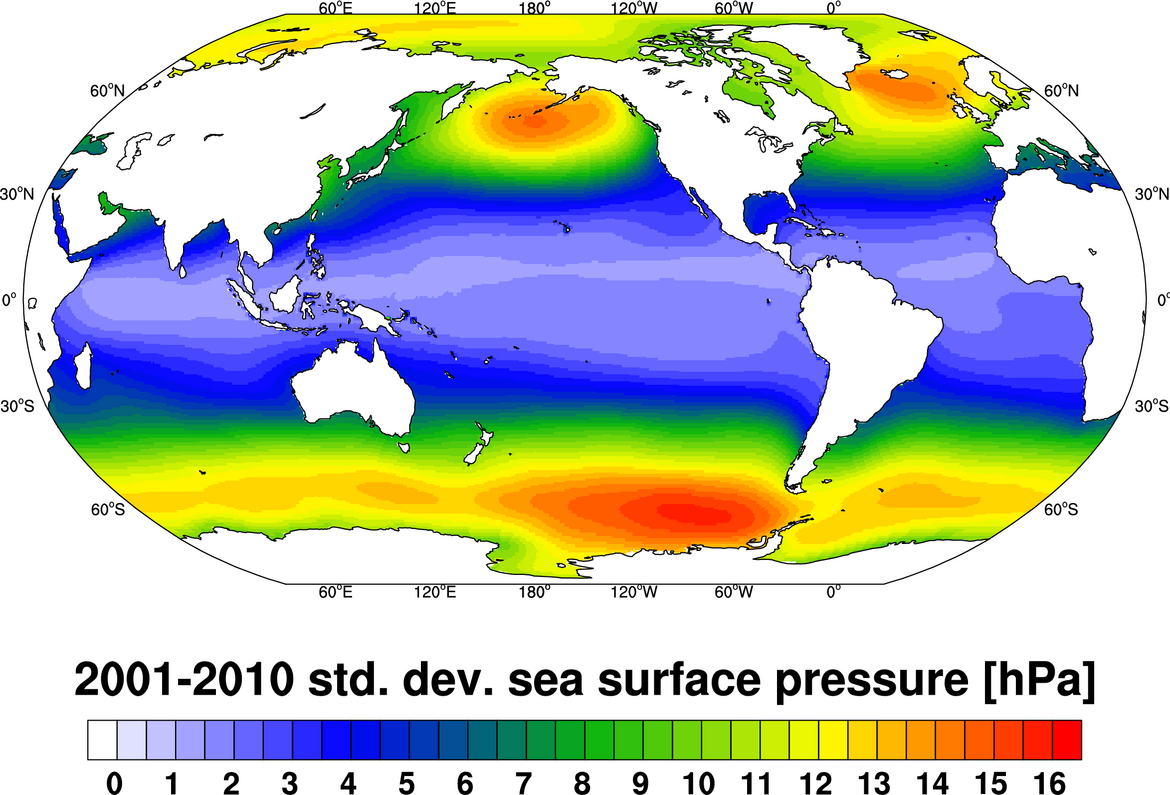
Figure 2: Standard deviation of ECMWF mean sea-level pressure over the period 2001 - 2010.
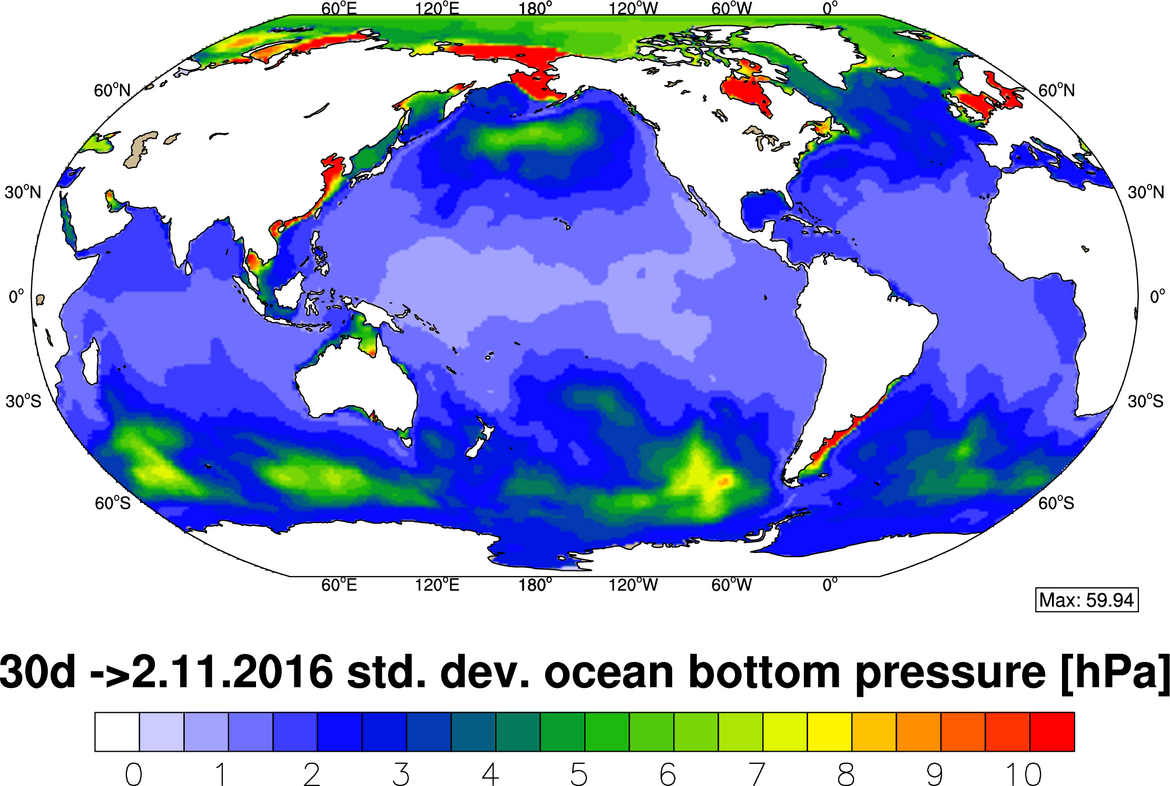
Figure 3: Variability (standard deviation) of simulated ocean bottom pressure over 30 days from October/November 2016.
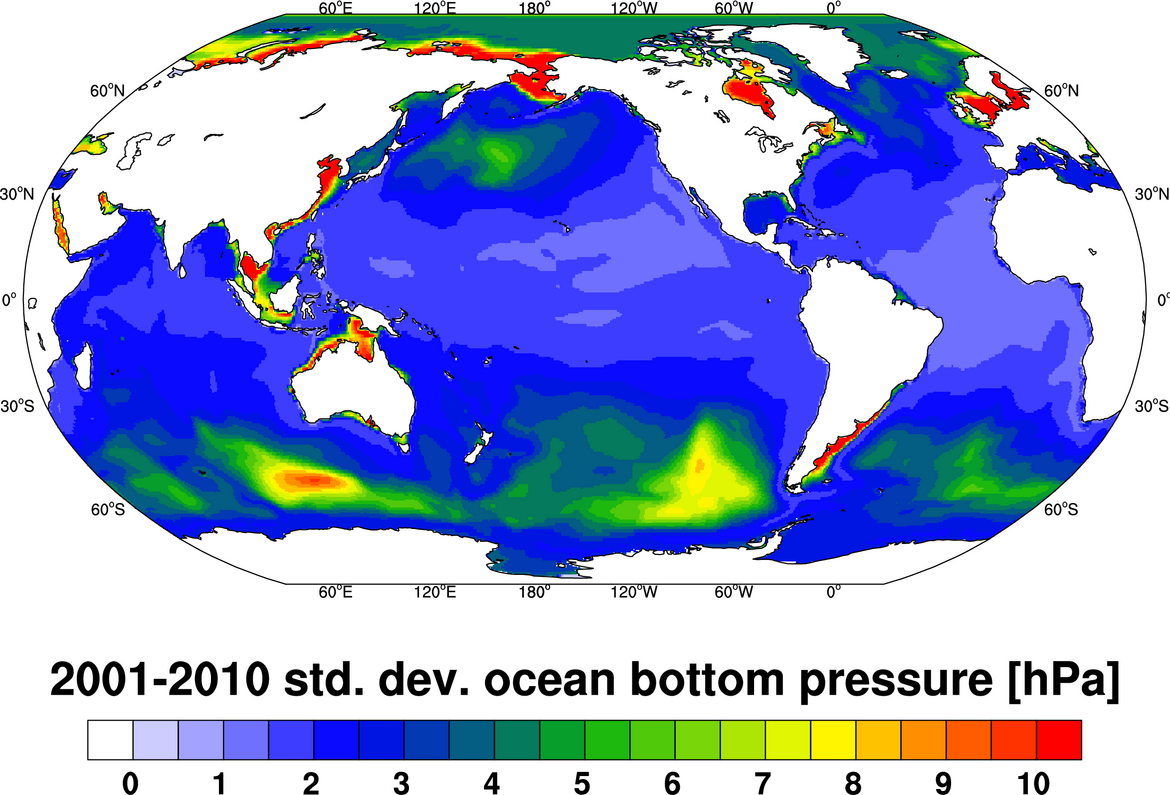
Figure 4: Standard deviation of simulated ocean bottom pressure over the period 2001 - 2010.
Bottom pressure variability
The following figures contain information about different characteristics of the simulated bottom pressure fields. Figures are updated daily and represent averages over the most recently simulated 30 days.

Figure 5: Animation of ECMWF mean sea-level pressure anomalies relative to mean fields for 2001+2002 for October/November 2016. Please click on this link to start the animation.
Figure 6: Animation of simulated ocean bottom pressure anomalies relative to mean fields for 2001+2002 for October/November 2016. Please click on this link to start the animation.
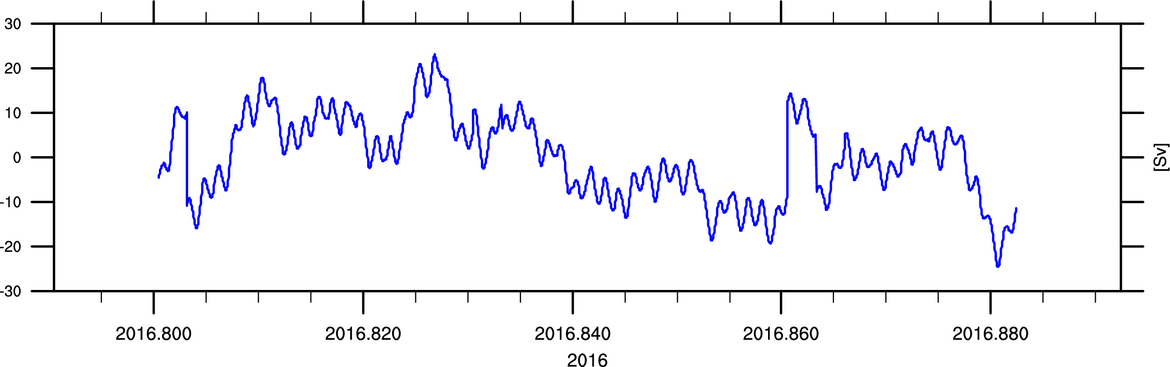
Figure 7: Water mass transports of the Antarctic Circumpolar Current (ACC) across the Drake Passage as simulated by OMCT.
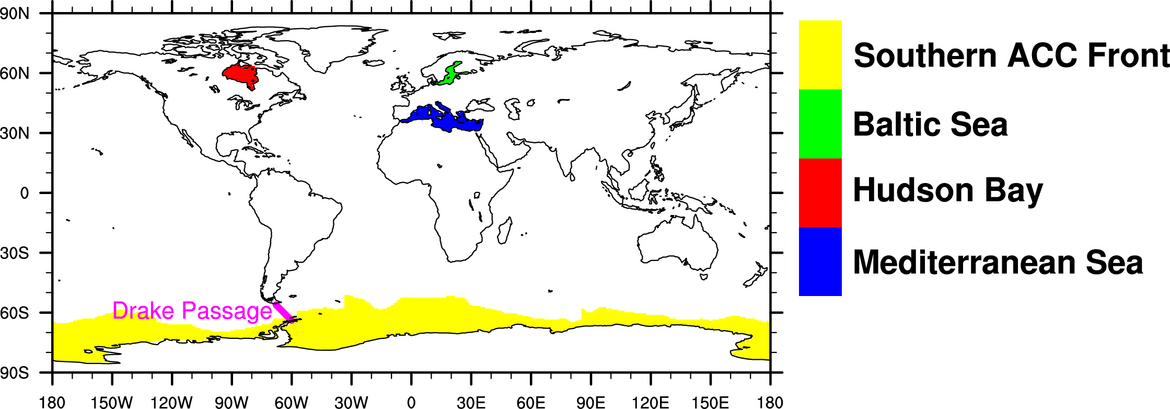
Figure 8: Geographical extent of averaging regions for Figure 9-12.

Figure 9: Area-mean bottom pressure anomalies relative to a mean field for 2001+2002 for the Hudson Bay. Shape and geographical extent of the averaging regions migt be obtained from Figure 8.
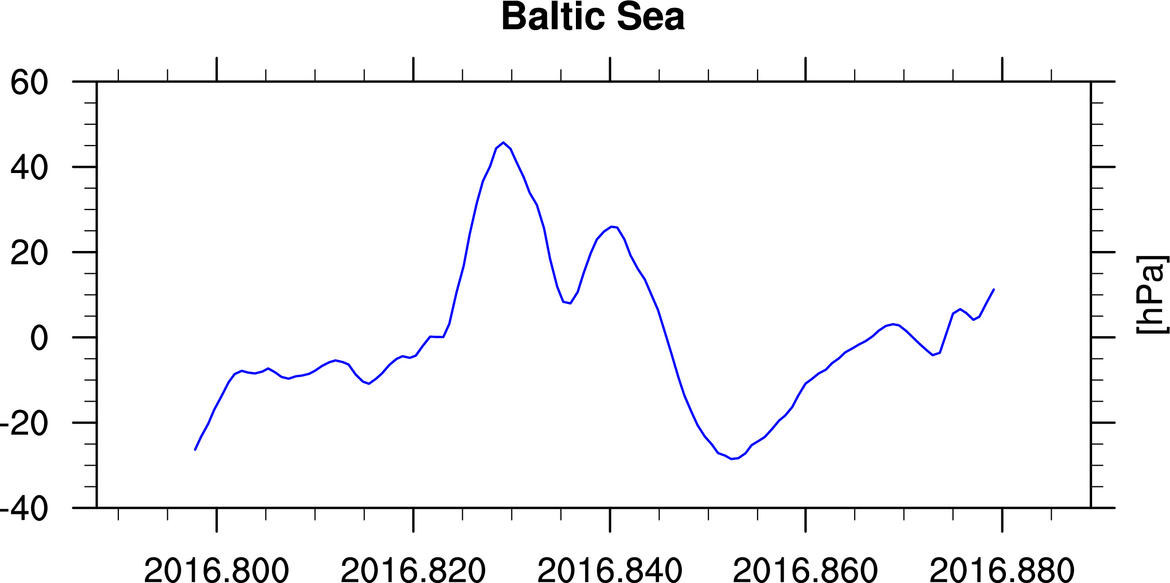
Figure 10: Area-mean bottom pressure anomalies relative to a mean field for 2001+2002 for the Baltic Sea. Shape and geographical extent of the averaging regions migt be obtained from Figure 8.
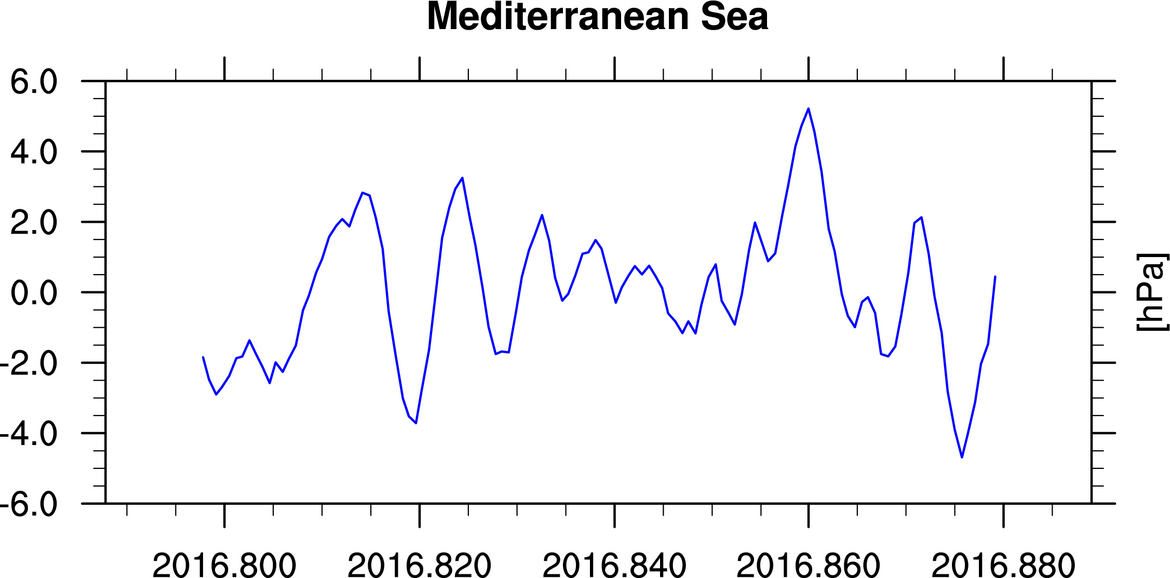
Figure 11: Area-mean bottom pressure anomalies relative to a mean field for 2001+2002 for the Mediterranean Sea. Shape and geographical extent of the averaging regions migt be obtained from Figure 8.
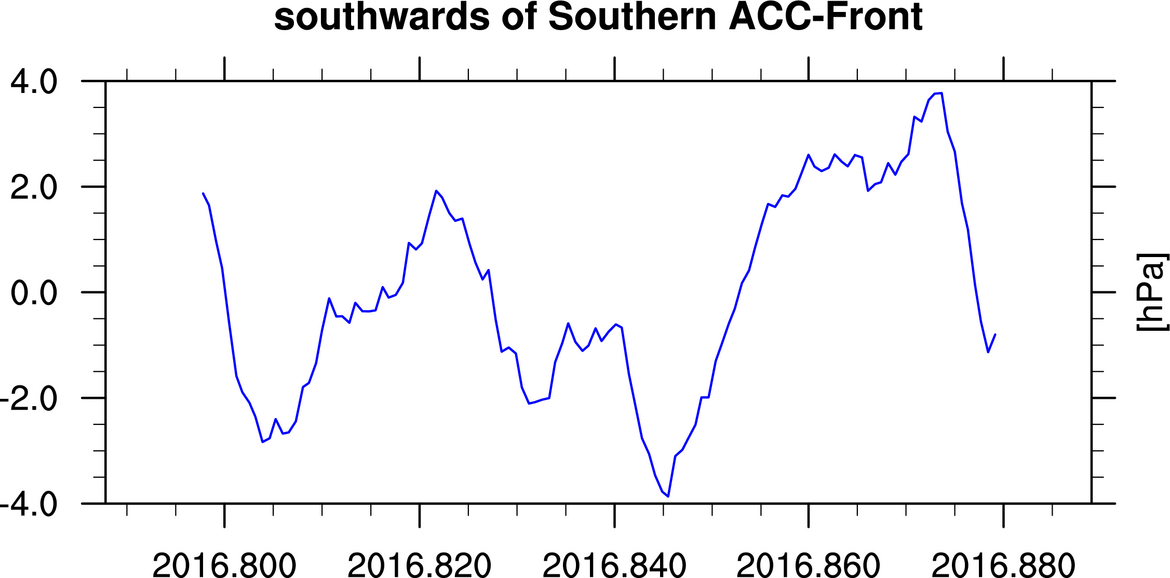
Figure 12: Area-mean bottom pressure anomalies relative to a mean field for 2001+2002 for the coastal waters around Antarctica southwards of the Sourthern ACC front. Shape and geographical extent of the averaging regions migt be obtained from Figure 8.
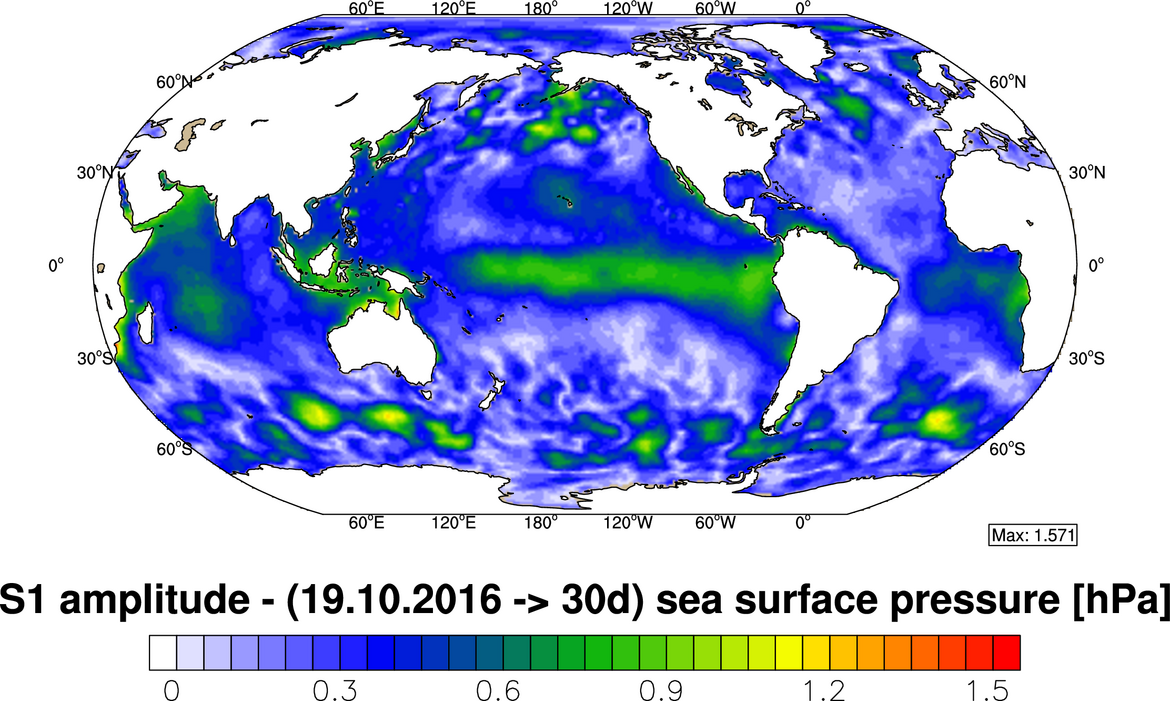
Figure 13: Mean amplitudes of diurnal atmospheric tides in atmospheric surface pressure over 30 days from October/November 2016.
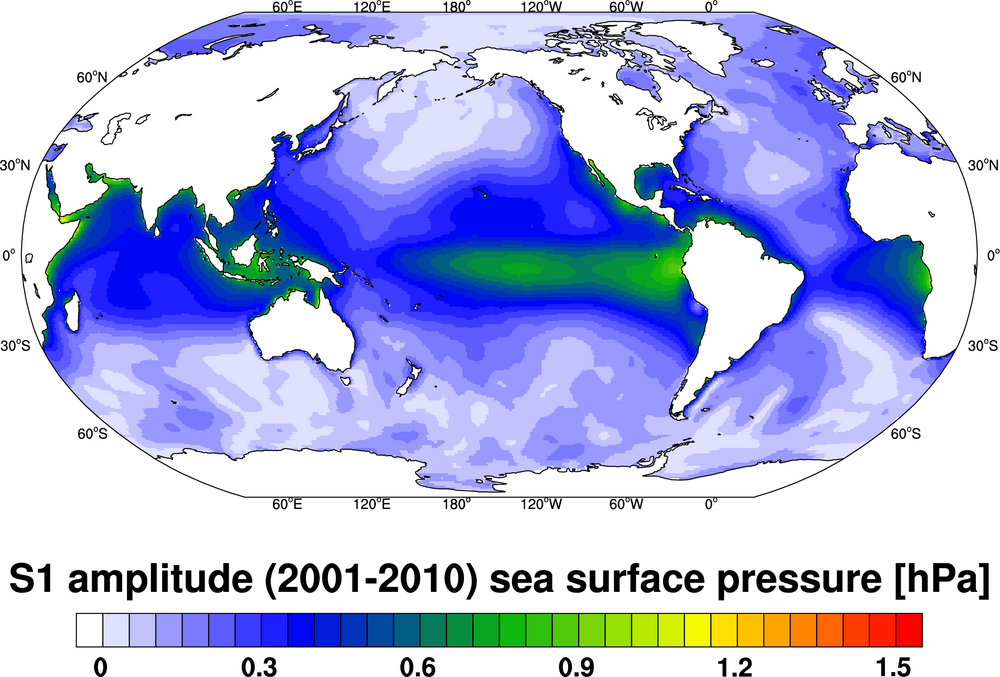
Figure 14: Mean amplitudes of diurnal atmospheric tides in atmospheric surface pressure over the period 2001 - 2010.
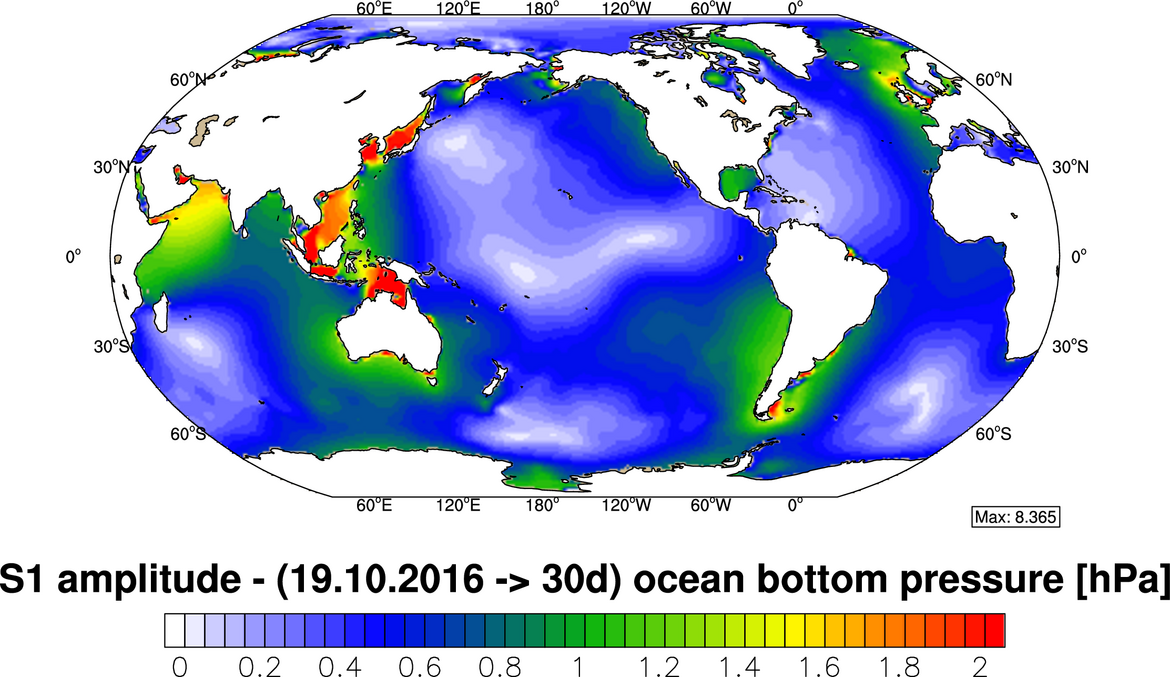
Figure 15: Mean amplitudes of diurnal atmospheric tides in ocean bottom pressure over 30 days from October/November 2016.
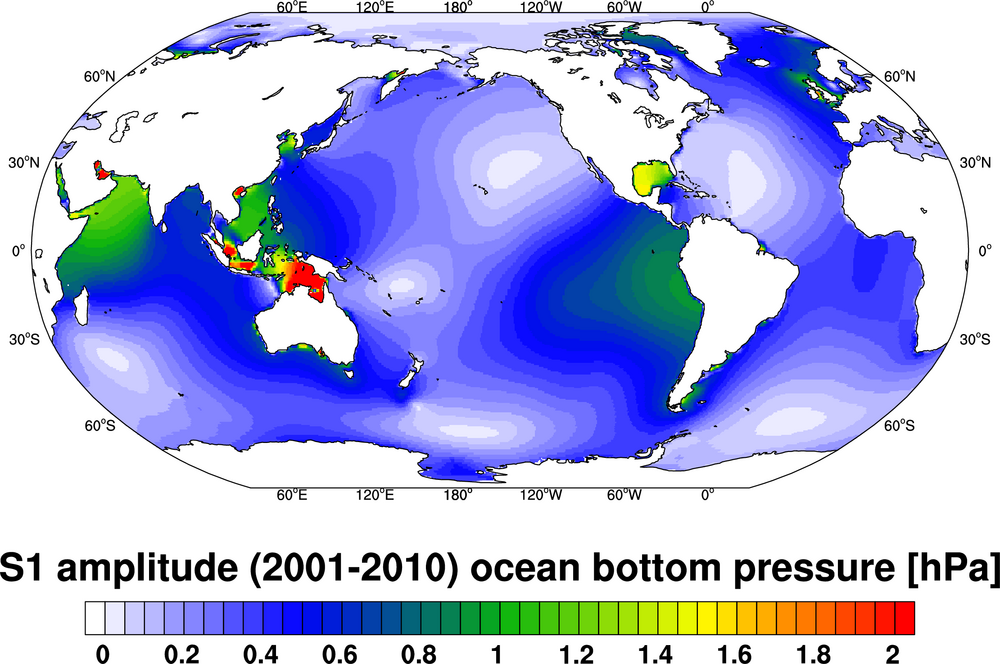
Figure 16: Mean amplitudes of diurnal atmospheric tides in ocean bottom pressure over the period 2001 - 2010.
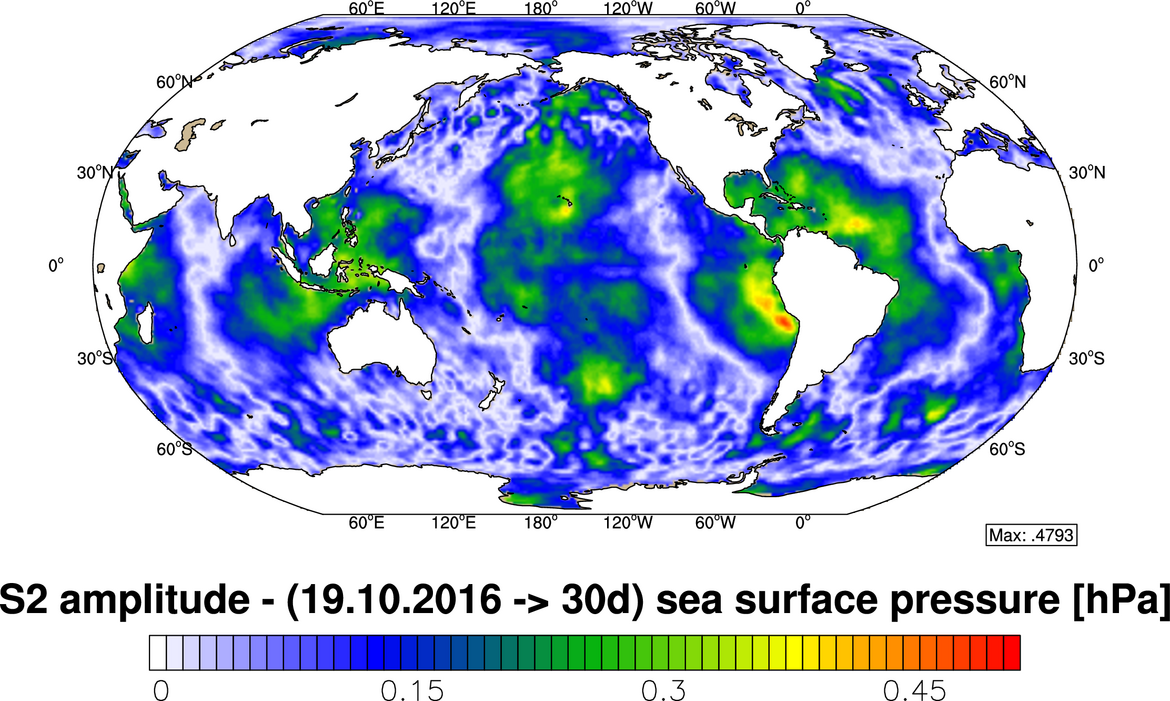
Figure 17: Mean amplitudes of semidiurnal atmospheric surface pressure averaged over 30 days from October/November 2016. Note that semidiurnal variability at the S2 frequency has been largely removed by means of an correction model, since S2 bottom pressure variability due to atmospheric pressure forcing is already included in altimetry-based ocean tide models applied in the GRACE gravity field processing. Semidiurnal variability present here merely represents residual amplitudes related to seasonal modulations or (eventually) longterm changes in the atmospheric tides.
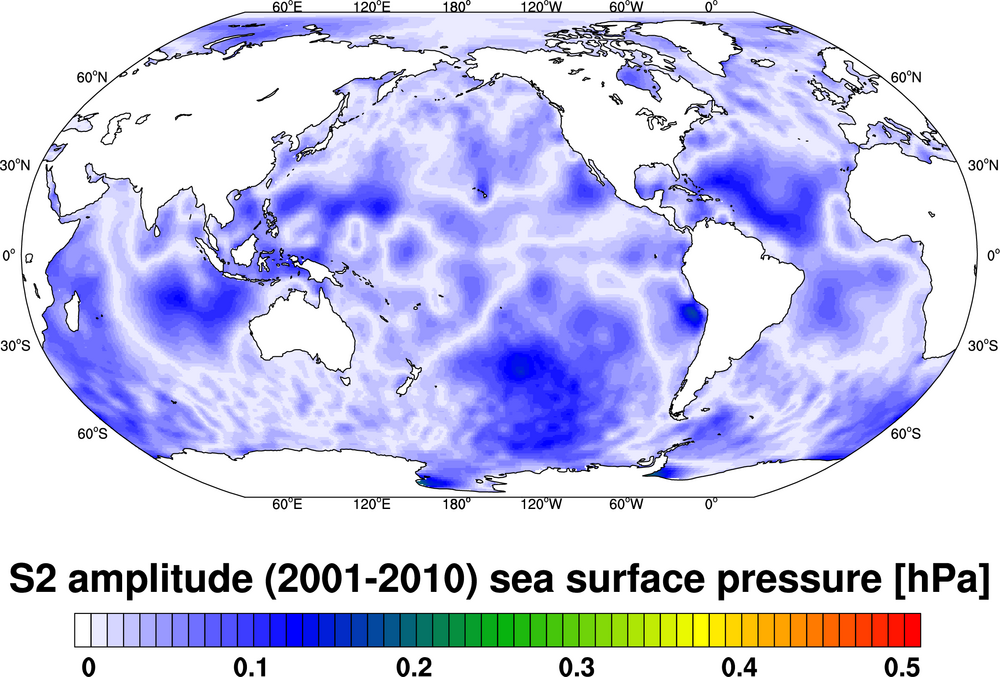
Figure 18: Mean amplitudes of semidiurnal atmospheric surface pressure averaged over the period 2001 - 2010. Note that semidiurnal variability at the S2 frequency has been largely removed by means of an correction model, since S2 bottom pressure variability due to atmospheric pressure forcing is already included in altimetry-based ocean tide models applied in the GRACE gravity field processing. Semidiurnal variability present here merely represents residual amplitudes related to seasonal modulations or (eventually) long-term changes in the atmospheric tides.
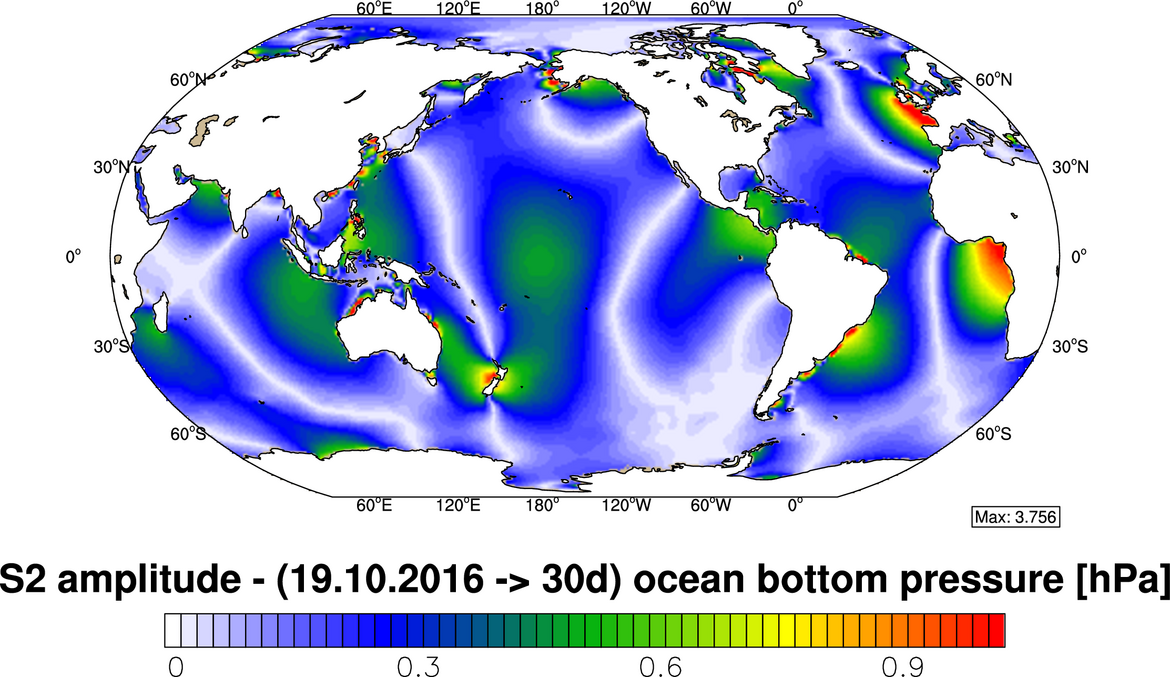
Figure 19: Mean amplitudes of semidiurnal ocean bottom pressure averaged over 30 days from October/November 2016. Note that semidiurnal variability at the S2 frequency has been largely removed by means of an correction model, since S2 bottom pressure variability due to atmospheric pressure forcing is already included in altimetrybased ocean tide models applied in the GRACE gravity field processing. Semidiurnal variability present here merely represents residual amplitudes related to seasonal modulations or (eventually) long-term changes in the atmospheric tides.
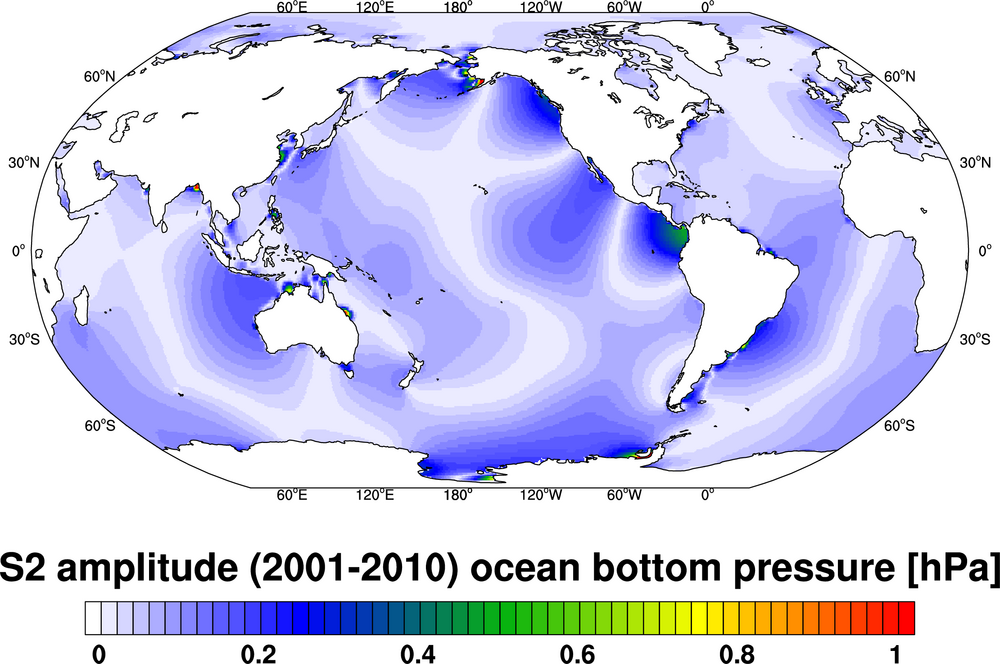
Figure 20: Mean amplitudes of semidiurnal ocean bottom pressure averaged over the period 2001 - 2010. Note that semidiurnal variability at the S2 frequency has been largely removed by means of an correction model, since S2 bottom pressure variability due to atmospheric pressure forcing is already included in altimetry-based ocean tide models applied in the GRACE gravity field processing. Semidiurnal variability present here merely represents residual amplitudes related to seasonal modulations or (eventually) long-term changes in the atmospheric tides.
Reference Paper
Dobslaw, H., Flechtner, F., Bergmann-Wolf, I., Dahle, C., Dill, R., Esselborn, S., Sasgen, I., Thomas, M. (2013): Simulating high-frequency atmosphere-ocean mass variability for de-aliasing of satellite gravity observations: AOD1B RL05. - Journal of Geophysical Research, 118, 7, p. 3704-3711, doi.org/10.1002/jgrc.20271.
