Further information:
Seismicity in Europe and in a global scale
Crustal stress field in the earth crust as cause of seismicity


Earthquakes which are felt by humans, or maybe even cause damages, are rare in Germany. The majority of Germany’s earthquake faults are concentrated in three zones of crustal weakness:
the Rhine area,
the Swabian Alb and
Eastern Thuringia and Western Saxony, including the earthquake swarm area of Vogtland.
Selected strong earthquakes in Germany during the last 250 years are listed in Table 1. Here it is seen that the largest observed intensity in historical time is VIII.
| Table 1. Selected damaging earthquakes in Germany since 1750 | ||||
| Date | Location | Max. intensity I0 | Magnitude ML | Casualties, damaged buildings (DB) and economical losses |
| 18.02.1756 | Düren (east of Aachen) | VIII | 6,1 | Casualties |
| 24.06.1877 | Herzogenrath (north of Aachen) | VIII | 5,3 | |
| 26.08.1878 | Tollhausen (west of Cologne) | VIII | 5,9 | Casualties |
| 16.11.1911 | Albstadt (south of Tübingen) | VIII | 6,1 | 6250 DB; 0,75 Mio. RM |
| 27.06.1935 | Saulgau (northeast of Konstanz) | VII-VIII | 5,8 | |
| 28.05.1943 | Albstadt | VIII | 5,6 | |
| 14.03.1951 | Euskirchen (west of Bonn) | VII-VIII | 5,7 | |
| 03.09.1978 | Albstadt | VII-VIII | 5,7 | 6250 DB; 0.75 Mill. RM |
| 13.04.1992 | Heinsberg/ Roermond (NL) | VII | 5,9 | 1 casualty; 7200 DB; 250 Mill. DM |
Earthquakes with a magnitude of ML = 5.1 (Mw = 4.8) are observed in Germany with an average return period of 10 years. Earthquakes of ML = 5.8 (Mw = 5.5) are observed on average every 50 years, whereas the historically largest magnitudes (ML = 6.1; Mw = 5.8) are observed with an average return period of ca. 100 years.
In addition to the German earthquakes, events occurring outside the borders of the country can also cause ground shaking in Germany. For example, the Roermond earthquake (with its source in the border region between Germany and the Netherlands) on April 13, 1992 (ML = 5.9, I0 = VII) was felt in parts of North Rhine-Westphalia, Rhineland-Palatinate and the neighbouring federal states. Due to the relatively large depth of this earthquake (18-20 km), damages were moderate. The Friuli earthquake in Italy on May 6, 1976 (ML = 6.4, I0 = IX-X) was felt in large parts of Bavaria, Saxony, Thuringia and Saxony-Anhalt, and even at some locations in the Berlin area.
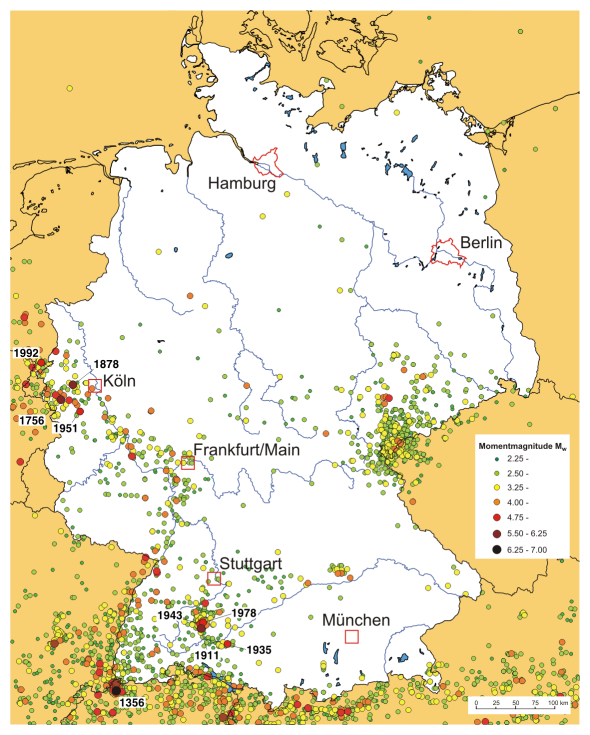
Figure 1. Earthquake epicentres in Germany and neighbouring areas in the time 1000-2001 (from Grünthal, 2003, based on data from Grünthal and Wahlström, 2003a, b).
The epicentre map of historical German earthquakes (Figure 1) clearly shows that earthquake activity is not evenly distributed over the German area, but is rather concentrated in regions of high seismicity. The most active region is the seismic zone of the Rhine area, extending to the Cologne area in the north, and from there westwards towards Limburg (in the Netherlands) and Belgium. In the Lower-Rhine area, the highest seismicity is observed in the Aachen-Düren area. The region around Koblenz has the highest activity in the Middle-Rhine area, and in the northern Upper-Rhine area in the region between Karlsruhe and Mainz, high seismicity is observed in the northernmost and the southernmost (i.e. the area Rheinstetten-Rastatt) parts. The southern part of the Upper-Rhine area has its highest activity in the region around Strasbourg and in its southern part.
The earthquake zone of the Swabian Alb, with the highest activity around Albstadt, was struck by one of the strongest German earthquakes in historical time on November 16, 1911 with a magnitude of ML = 6.1. With two additional damaging earthquakes in 1943 and 1978 (Figure 2; with damages corresponding to intensity VII-VIII), this narrow seismic zone has released far the largest part of earthquake energy in Germany in the 20th century.
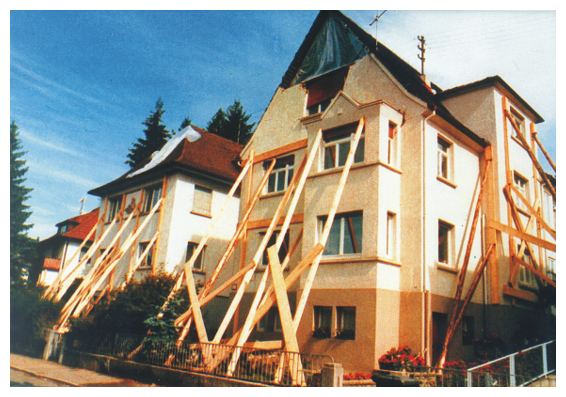
Figure 2. Damages due to the Albstadt earthquake on September 3, 1978 observed in Tailfingen (Baden-Württemberg) (Reference: Landesstelle für Bautechnik Baden-Württemberg)
The Swabian Alb earthquake zone continues northward towards Thuringia. With the additional fault areas in Saulgau, to the southwest of Donaueschingen and in the Black Forest, Baden-Württemberg is the federal state with the highest earthquake activity in Germany.
A further area with elevated seismicity is in eastern Thuringia and western Saxony, stretching from the Swarm area of Vogtland over the Gera area to Leipzig. The largest historical earthquake in this region occurred on March 3, 1872 east of Gera with a maximum intensity of VII. The earthquake swarms of Vogtland, where up to 10,000 earthquakes were instrumentally recorded in 1903, 1908 and during the winter 1985-86, reach magnitudes of 4.7 and intensities of VI-VII for the largest events.
A seismic area of less importance is the region of Nördlingen-Donauwörth, where earthquakes with maximum intensity VII occurred in 1769 and 1915. The remaining parts of Germany are not completely aseismic, but have only sparse earthquake activity. For example, the Bielefeld earthquake in 1612 caused minor damages (Figure 3).

Figure 3. The Bielefeld earthquake in 1612. Cracks in the monastery walls and falling dishes are shown in a contemporary copper engraving (reproduced from Vogt and Grünthal, 1994).
The earthquakes in Germany are mainly located at depths between 5-20 km with the majority of the seismic energy release around 10 km.
A seismic network of ca. 100 stations is currently operated in order to register the earthquake activity in Germany. The first seismographs were installed in the beginning of the 20th century. From the pre-instrumental time there exist comprehensive reports of felt earthquakes and observed damages, mainly in town chronicles. These historical sources make the extension of earthquake catalogues possible until the beginning of the historical records. Furthermore, paleoseismological investigations in the Lower-Rhine area revealed the occurrence of several strong earthquakes with magnitudes up to 6.8 before the 10th century.
It is clear that the earthquake catalogues are less complete and only include the strongest earthquakes for the historical times. The completeness of data for the catalogue of the Rhine area is illustrated in Figure 4, where the number of observations of each individual intensity class (from III to IX) is plotted as a function of time since 1000 AD.
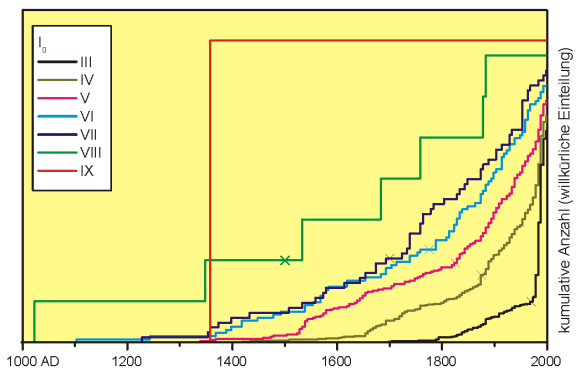
Figure 4. Cumulative number of earthquakes per intensity class (I0) in the Rhine area. Crosses mark the estimated completeness time for each intensity level (from Grünthal et al., 1998).
Figure 4 clearly shows a linear increase for e.g. intensity VIII since ca. 1500 AD. For earthquakes with intensity VII, a linear increase is observed since ca 1700 AD (marked with a cross in Figure 4), for intensity VI since ca. 1775, for intensity V since ca. 1825 etc.
References:
Grünthal, G.: Wo in Deutschland die Erde bebt. In: Nationalatlas Bundesrepublik Deutschland, Band 2: Relief, Boden und Wasser, Institut für Länderkunde, Spektrum Akademischer Verlag, Heidelberg/Berlin, 44-45, 2003.
http://www.gfz-potsdam.de/bib/pub/str0302/0302.htm
Vogt, J. and Grünthal, G.: Die Erdbebenfolge vom Herbst 1612 im Raum Bielefeld - Ein bisher unberücksichtigtes Schadenbeben. Geowissenschaften 12 (8), 236-240, 1994.