

Time Frame: Phase IV 2017-2025
Funding: GFZ Potsdam
Principal Investigator: Oliver Heidbach
Personnel: Moritz Ziegler, Steffi Lammers, Kirsten Elger, Vivien Lindemann
Project Website: www.world-stress-map.org
Cooperations: Paola Montone, INGV Rome, Italien; Birgit Müller, KIT, Deutschland; John Reinecker, Geo.T Engineering; Deutschland; Karsten Reiter, TU Darmstadt, Deutschland; Mojtaba Rajabi and Mark Tingay, University of Adelaide, Australien; Furen Xie, ICD Beijing, China; Mark Zoback, Stanford Univ., USA
The World Stress Map (WSM) is a global compilation of information on the crus-tal present-day stress field maintained since 2009 at the Helmholtz Centre Potsdam GFZ German Research Centre for Geosciences in the Section 2.6 Seismic Hazard and Risk Dynamics. It is a collaborative project between aca-demia and industry that aims to characterize the crustal stress pattern and to understand the stress sources. The WSM commenced in 1986 as a project of the International Lithosphere Program (ILP) under the leadership of Mary-Lou Zoback. From 1995 to 2008 it was a project of the Heidelberg Academy of Sci-ences and Humanities headed by Karl Fuchs and Friedemann Wenzel. Since 2012 the WSM is a member of the ICSU World Data System. All stress infor-mation is analysed and compiled in a standardized format and quality-ranked for reliability and comparability on a global scale. The current new WSM data-base release 2016 contains 42,870 data records within the upper 40 km of the Earth’s crust.
The WSM is an open-access public database and is used by various academic and industrial institutions working in a wide range of Earth science disciplines such as geodynamics, hazard assessment, hydrocarbon exploitations and en-gineering. The main operational areas are:
- Reservoir characterization and management
- Stability of mines, tunnel, boreholes and waste disposal sites
- Calibration of geomechanical-numerical models
- 4D Thermo-Hydro-Mechanical (THM) models
- Hazard assessment e.g. by means of fault-slip tendency analysis
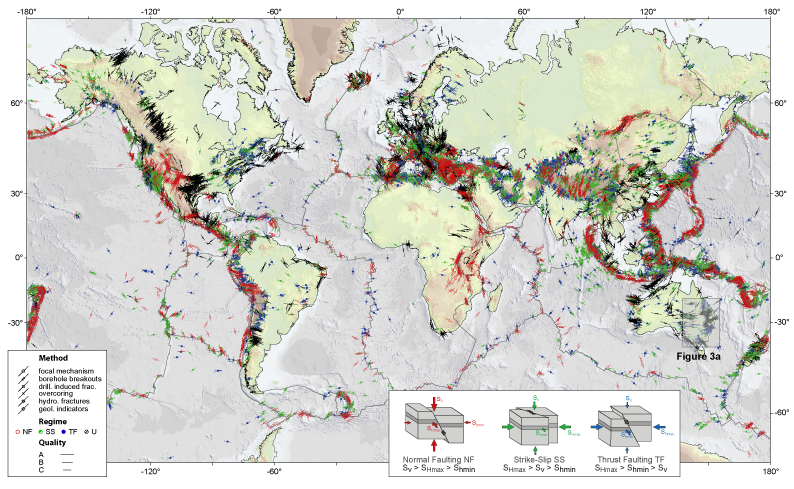
World Stress Map 2016 | The stress map shows the orientation of maximum horizontal stress SHmax in the Earth's crust (Heidbach et al. 2016). Symbols denote the SHmax orientation from various stress indicators. Colours denote the stress regime: normal faulting (NF), strike-slip (SS), thrust faulting (TF) and unknown (U).
Publications/Results
- Heidbach, O., Rajabi, M., Reiter, K., Ziegler, M., and WSM Team (2016). World Stress Map Database Release 2016, GFZ Data Services, doi.org/10.5880/WSM.2016.001
- Heidbach, O., J. Reinecker, M. Tingay, B. Müller, B. Sperner, K. Fuchs, and F. Wenzel (2007). Plate boundary forces are not enough: Second- and third-order stress patterns highlighted in the World Stress Map database. Tectonics 26(6): TC6014, doi.org/10.1029/2007TC002133
- Rajabi, M., M. Tingay, O. Heidbach, R. Hillis, and S. Reynolds (2017). The present-day stress field of Australia. Earth Sc. Rev. 168: 165-189, doi.org/10.1016/j.earscirev.2017.04.003
- Tingay, M., B. Müller, J. Reinecker, O. Heidbach, F. Wenzel, and P. Fleckenstein (2005). Understanding tectonic stress in the oil patch: The World Stress Map Project. The Leading Edge, 1276-1282
- Zoback, M. L. (1992). First and second order patterns of stress in the lithosphere: The World Stress Map Project. J. of Geophys. Res. 97: 11703-1172, doi.org/10.1029/92JB00132

