

Overview
Studies of historical earthquakes of the past few thousand years, paleoseismic studies and instrumental earthquake studies of the last 100 years demonstrate that a number of damaging earthquakes have occurred along the Dead Sea Transform (DST), the large shear zone running from the Gulf of Aqaba/Eilat through the Dead Sea into the Lake of Galilee (Fig. 1). Seismicity shows a clustering in the Dead Sea Basin (DSB; Fig. 2), which is close to the population centers of Israel, Jordan and Palestine. The distance from the last big event in the Dead Sea (1927, M = 6.3) to Jericho, Jerusalem, Amman and Nablus is 25 km, 25 km, 60 km and 70 km respectively (see also Fig. 3 for examples of damage). Recent estimates suggest Mw » 7 earthquakes along the DST about every 200 years (Klinger et al. 2000b) and/or M = 6 earthquakes every 100 years (R. Hofstetter; personal communication). Earthquakes along the DST and in the Dead Sea Basin therefore pose a considerable seismic hazard to Israel, Jordan and Palestine (Fig. 4).
Laufzeit
- 2006 - 2014
Zuwendungsgeber
- DFG - Deutsche Forschungsgemeinschaft
- GFZ - Helmholtz-Zentrum Potsdam - Deutsches GeoForschungsZentrum GFZ
- BGR - Bundesanstalt für Geowissenschaften und Rohstoffe
Projektverantwortliche
- M. Weber (GFZ)
ProjektmitarbeiterInnen
- Benjamin Braeuer (GFZ)
- Naser Meqbel (GFZ)
Time frame
- 2006 - 2014
Funding
- DFG - German Research Foundation
- GFZ - Helmholtz Centre Potsdam - GFZ German Research Centre for Geosciences
- BGR - Bundesanstalt für Geowissenschaften und Rohstoffe
Principal Investigators
- M. Weber (GFZ)
Personnel
- Benjamin Braeuer (GFZ)
- Naser Meqbel (GFZ)

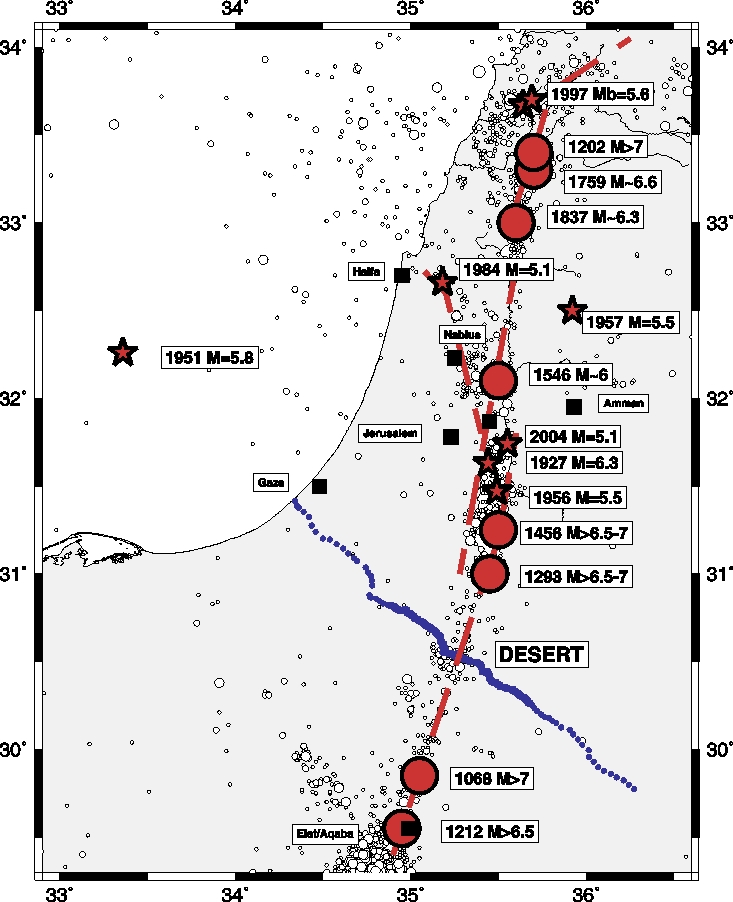
Figure 1
Seismicity in the Middle East. Large earthquakes from 1000 to 1900 are given as red dots together with their estimated magnitude. Large earthquakes from 1900 to 2004 are given as stars (including year and magnitude). Seismicity from 1984 to 2004 is given as small white circles. The dashed red lines indicate the major faults. The white arrows show the 105 km displacement of the Arabian plate (right) relative to the African plate (left) in the last 20 MY. The DESERT profile is given in blue.

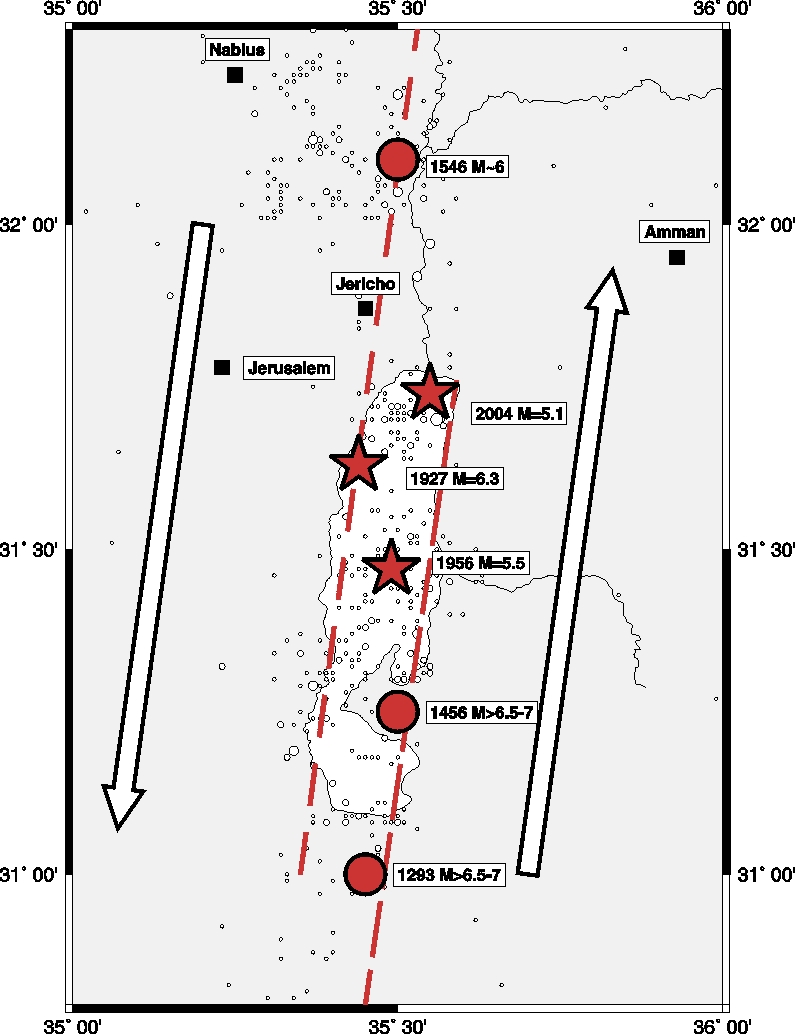
Figure 2
Seismicity in the Dead Sea area. Large earthquakes from 1000 to 1900 are given as red dots with their estimated magnitude. Large earthquakes from 1900 to 2004 are given as stars. Seismicity from 1984 to 2004 is given as small white circles. The dashed red lines indicate the major faults. The white arrows show the 105 km displacement of the plates in the last 20 MY.

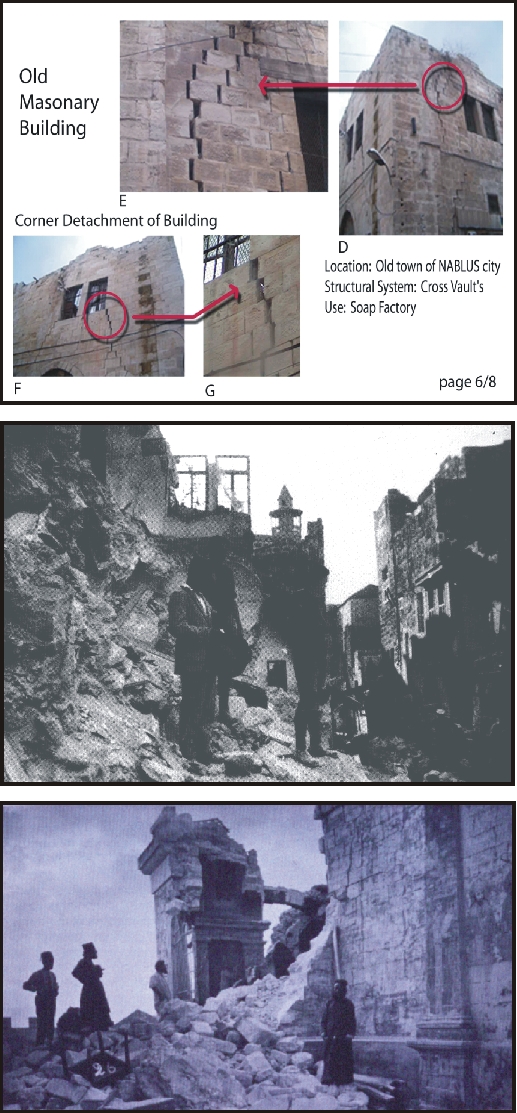
Figure 3
Damage from large Dead Sea earthquakes in the last 80 years. (Top) Nablus after the 11th February 2004 earthquake (mb = 5.1); see also Fig. 2 for earthquake and city location. (Middle) Nablus after the 1927 earthquake (M = 6.3). (Bottom) Jericho after the 1927 earthquake (M = 6.3).

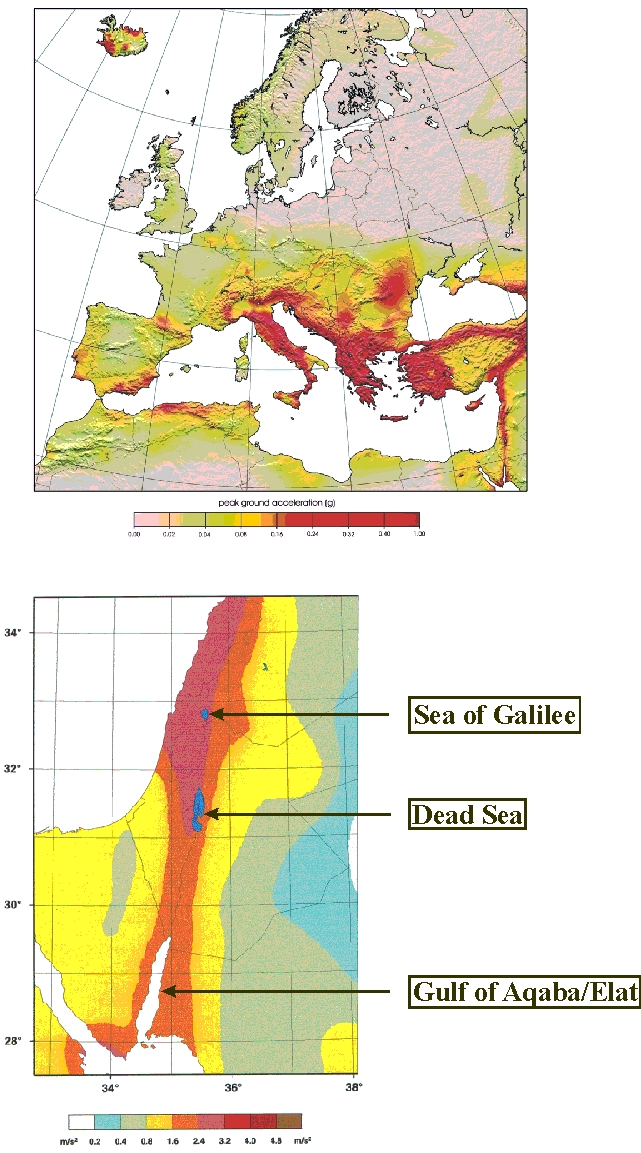
Figure 4
European and Middle East peak ground acceleration map. Shown is the 10% probability that the corresponding peak acceleration is exceeded within 50 years (Top) Giardini et al (2003), (Bottom) Enlarged from Grünthal et al (1999) on the basis of data from the internet address seismohazard.gfz-potsdam.de .
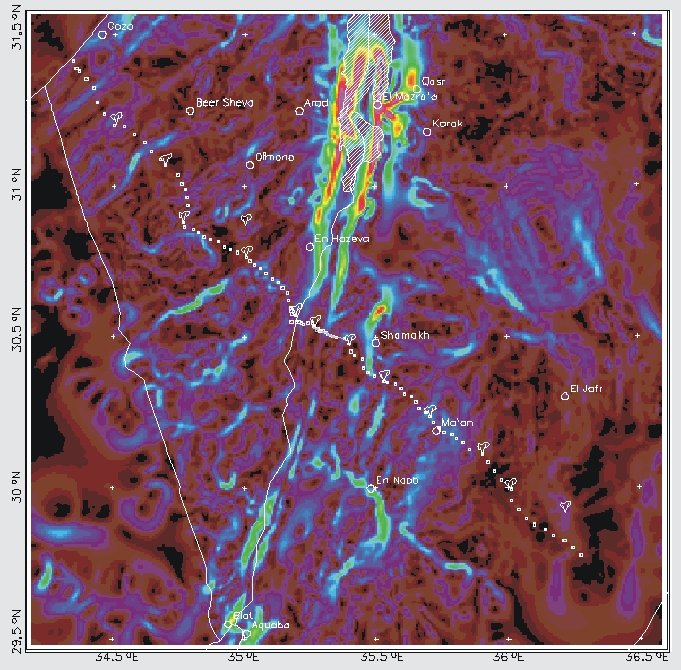
Figure 5
Segmentation of DST by dip angle analysis: strong gradients (yellow & red colors) are determined in the north and weak gradients (dark brown & blue) in the central part, for more information see also Project 3 (Aero-Gravity; and references therein). The white circles indicate the DESERT profile.
