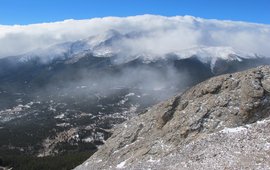
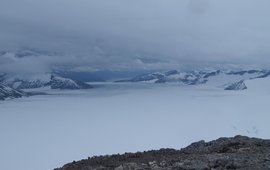
The permafrost-laden landscape of the Arctic is highly susceptible to degradations in the warming climate, and harbours the potential to exacerbate climate change due to its huge store of soil organic carbon. Large-scale monitoring and fast predictive simulations of permafrost-related features and natural systems are thus urgent and important. The project aims to develop both a deep-learning model capable of detecting and quantifying permafrost-landscape changes, and a physics-informed deep-learning framework to enable rapid modelling of complex Arctic surface-processes systems.

Research and Modelling
Our section's work is organised around various projects that involve for the most part a modelling component. They cover a broad range of topics that are focused on the quantitative understanding of Earth surface evolution, the parameterisation of processes and the nature and efficiency of the links with climate, tectonics and life.
Below are some examples of our modelling work. Please click on the graphics to expand and view in larger size.
• Reference: Fedele & Paola. (2007). JGR: ES 112(F2).
Modelling Grain Size Evolution within Fluvial Systems
Changes in grain size within river systems serve as an indicator of past climatic and tectonic events within the sedimentary record and play an important role in defining channel and bed morphology. Thus, it is crucial to thoroughly understand the relationship between grain size fining and landscape response over long time scales. To reproduce the fluvial stratigraphic record, Fedele and Paola (2007) developed a self-similar model of grain size fining along a river profile for riverine substrate that collapses many of the hydraulic and bed surface details relevant for simulating modern grain size transport.
Movie 1: Sample GSFast results: an incorporation of the Fedele and Paola (2007) self-similar grain size model into multiple dimensions (3D) within the Fastscape and averaged across the basin into a single long profile. Although only the basin area has been plotted, an uplifting mountain catchment (source) area to the left (on the long profile) is feeding into a subsiding basin that is draining (sink) towards the right. Across basin stratigraphic transects are indicated on the long profile figures as a red point. Reference: Fedele & Paola. (2007). JGR: ES 112(F2).
Movie 2: Sample GSFast results: an incorporation of the Fedele and Paola (2007) self-similar grain size model into multiple dimensions (Across basin, down basin, and over time/depth) within the Fastscape landscape evolution model. Although only the basin area has been plotted, an uplifting mountain catchment (source) area to the left (on the long profile) is feeding into a subsiding basin that is draining (sink) towards the right. Reference: Fedele & Paola. (2007). JGR: ES 112(F2).
We have generalized the Fedele and Paola (2007) self-similar model into three dimensions (across the basin, downstream, and over time) by removing the river length scaling and incorporating this grain size approach into the Fastscape landscape evolution model. Our three-dimensional approach to grain size fining (GSFAST) has shown that channel mobility in the alluvial basin strongly alter the deposition and grain size fining rate in a way unaccounted for using fewer dimensions. The implications of a landscape evolution model containing substrate grain size in three dimensions are in the model's application to constrain the environmental forcing conditions that would be plausible to produce observed field data. However, in our future work, we will need to first quantify what controls the avulsion rate in the model and compare this to the avulsion frequency in natural systems before applying GSFAST to interpret grain-size data. Reference: Fedele & Paola. (2007). JGR: ES 112(F2).
(c) Amanda Wild
Arctic-delta simulations
The Arctic is rapidly changing under a warming climate, which affects the polar regions even more than elsewhere on our planet. Many of these changes manifest themselves as landscape features resulting from surface processes of the Earth. We are developing deep-learning models to detect and quantify the changes related to such surface processes in the Arctic region. The outcome will enhance existing measurements and observations, providing an enriched dataset for investigating Arctic surface processes. To understand the underlying physics of this important and complex component of the Earth system, with the aid of available data, we are also developing a physics-informed deep-learning framework to enable efficient and accurate modelling of Arctic surface processes. The results should help researchers and decision makers to predict and assess the impact of climate change in this fragile region on our planet.
This movie shows an interactive visual analysis of a pair of example Arctic-delta simulations. The upper panel (with the colour bar) shows the top-down view of the deltas’ physical manifestations as one scrolls through time. In this particular instance, the bed elevation (‘η’) and unit discharge (‘qw', which is a measure of the quantity of water flowing through each pixel) are displayed in sequence. The middle panel shows the values displayed in the upper panel along the cross section marked by the yellow semi-circle. The bottom panel shows the averaged values along all similar semi-circles at a range of distances from the inlet, which is situated at the middle-bottom of the upper panel.
(c) Dr. Ngai Ham Chan
Marine terraces and sea level
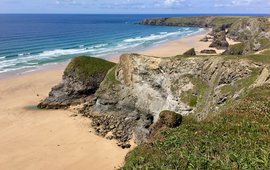
The marine terrace record is rich of information to reconstruct sea level in the past and determine how fast rocks are moving up and down under the same tectonic forces that create earthquakes. With my geologist colleagues at GFZ and elsewhere, we seek to better understand how the combination of sea level variations and rock movement result in marine terraces of different sizes and shapes. We can then use this understanding to look at natural landscapes and reconstruct the local history of rock deformation and sea level variations in the last million years.
The impact of lakes on long term evolution
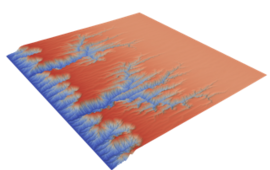
On this example, we ran the exact same initial landscape with the exact same tectonic or lithologic conditions, but the left scenario explicitly takes account of lake dynamics whereas the right one simply redirects the fluxes from the lake bottom to its outlet. Note the significantly different response time and plan-view geometry after 2 millions years.